Thank you for your feedback! You have rated this topic in the last 30 days.
About 2D Doughnut Charts
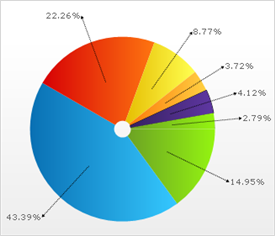
A 2D doughnut chart is a form of Pie chart. Like a pie chart, a doughnut chart shows the size of items that make up a data series proportional to the total of the items in the series.
This page has encountered an error. We've attempted to send the information to the server.