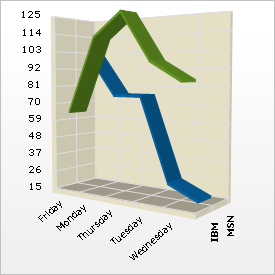
A 3D line chart emphasizes the amount of change over a period of time or compares multiple items. Data points are plotted in series using evenly-spaced intervals and connected with a line to emphasize the relationships between the points.
The 3D style is used to add visual emphasis to the chart. It does not provide an extra dimension for plotting data. However, the 3D line chart can help eliminate visual confusion where data sets are similar. A series of data items that would overlap and obscure one another in a 2D line chart can be easily distinguished when shown in a 3D line chart.