Thank you for your feedback! You have rated this topic in the last 30 days.
About 3D Stacked Cylinder Column Charts
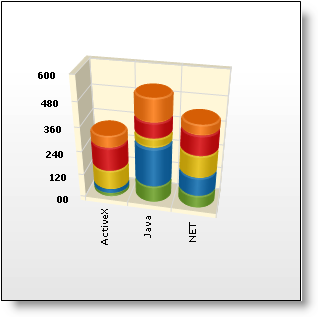
A 3D stacked cylinder column chart shows the changes in a data series over time or compares multiple items. Types of items are arranged horizontally and data values are plotted vertically to emphasize variation over time.
This page has encountered an error. We've attempted to send the information to the server.