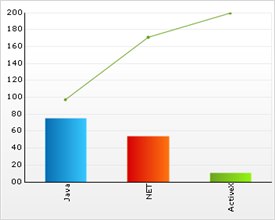
link:Infragistics.webui.ultrawebchart~infragistics.ultrachart.shared.styles.charttype.html[Pareto charts] are link:chart-column-chart-2d.html[column charts] sorted by value (greatest to smallest), and accompanied by a line which shows the running total as a percentage of the set.
The y-axis shows the data values which correspond to the columns, and the Y2-axis shows the percentage values which correspond to the line.
This chart is used in quality control, and is most commonly meant to illustrate the "80/20 rule". For example, "80% of problems can usually be tracked to 20% of sources" or "80% of sales come from 20% of products".