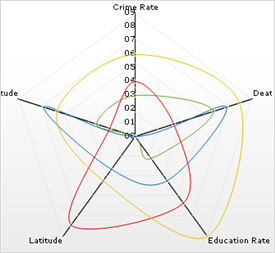
In a radar chart , each category has its own value axis radiating from the center point. Lines connect all the values in the same series. Radar charts, also called spider charts, are best used to show multiple variables, such as ratings for different areas, performance levels for various divisions or individuals, or progress in a project or other activity. A radar chart compares the aggregate values of a number of data series.