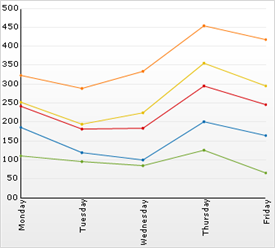
A stacked line chart is a line chart in which lines do not intersect, because they are cumulative at each point. In a stacked 100% line chart, the lines reach a total of 100% of the axis range at each point.
If you want your chart to display data in chronological order, and plot points across the x-axis according to elapsed time, see Display Data on a Time-Scale Axis.