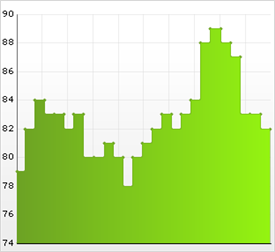
A step area chart is a special form of area chart which is useful for displaying changing numeric values over a period of time. The (horizontal) x-axis in a step area chart represents a period of time, and values are plotted on the (vertical) y-axis at constant or irregular time intervals. Step area charts are similar to step line charts, except in a step area chart the area occupied by the data series is filled in with color.
Step area charts are useful for plotting figures which change periodically or at unknown intervals, such as bank balances or mortgage rates.