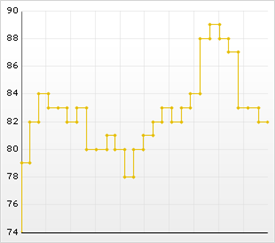
A step line chart is a special form of line chart which is useful for displaying changing numeric values over a period of time. The (horizontal) x-axis in a step line chart represents a period of time, and values are plotted on the (vertical) Y-axis at constant or irregular time intervals.
Step line charts are useful for plotting figures which change periodically or at unknown intervals, such as bank balances or mortgage rates.
If you want your chart to display data in chronological order, and plot points across the x-axis according to elapsed time, see .