
Tooltips are small windows which display a help text that explains parts of the chart items. They give useful information about the charted item in response to mouse movement or clicking.
Drilldown is the act of moving from the summary information to more detailed information. In WebChart™, drilldown is the act of producing another chart when items on the summary chart are clicked. This enables the examination of the detail of data underlying a summarized chart. For example: a summary chart has four columns representing sales summaries of the four quaters of a year. Drilldown will allow examination of the parts of sale for a particular quarter.
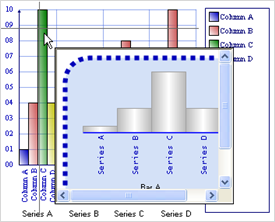
The most common way to provide drill-down in WebChart is to cause navigation to another page with another WebChart on it. However, it is also possible to provide "ToolTip drilldown", where detailed information is displayed in a ToolTip which reacts to moving the mouse over different parts of the summary chart.
The following is an example of how ToolTips can be combined with drilldown.
Given a stacked bar WebChart showing yearly expenses by category, a ToolTip drilldown should be able to show a column WebChart detailing how each region participated in that category of expense.
The following is an example of how to fulfill the requirements specified above.
Create the following two ASPX pages:
Main.aspx — Contains a stacked column chart.
BarDrill.aspx — Contains a bar chart.
In the Main.aspx file, in the Page_Load event handler, add the following example code:
In Visual Basic:
Me.UltraChart1.Tooltips.FormatString = _
  "<iframe src=BarDrill.aspx?ROW=<DATA_ROW>&COL=<DATA_COLUMN>>"
In C#:
this.UltraChart1.Tooltips.FormatString =
  "<iframe src=BarDrill.aspx?ROW=<DATA_ROW>&COL=<DATA_COLUMN>>";
On BarDrill.aspx, in the Page_Load event handler, add the following code:
In Visual Basic:
Private Sub Page_Load(ByVal sender As System.Object, _
  ByVal e As System.EventArgs) Handles MyBase.Load
	Dim ROW As Integer
	Dim COL As Integer
	If Not Page.Request("ROW") Is Nothing Then
		ROW = CInt(Page.Request("ROW"))
	End If
	If Not Page.Request("COL") Is Nothing Then
		COL = CInt(Page.Request("COL"))
	End If
	Me.UltraChart1.DataSource = GetBarData()
	Me.UltraChart1.DataBind()
End Sub
In C#:
private void Page_Load(object sender, System.EventArgs e)
{
	int ROW = 0;
	int COL = 0;
	if (Page.Request["ROW"] != null)
	{
		ROW = int.Parse(Page.Request["ROW"]);
	}
	if (Page.Request["COL"] != null)
	{
		COL = int.Parse(Page.Request["COL"]);
	}
	this.UltraChart1.Data.DataSource = GetBarData();
	this.UltraChart1.Data.DataBind();
}