UltraChart.Axis.X.Labels.ItemFormatString = "“<DATA_VALUE:##.##>"
This topic discusses useful information that will help you to ensure that your data is rendered properly in the 3D stacked cylinder column chart.
While the Chart control allows you to easily point the chart to your own custom data, it is important that you are supplying the appropriate amount and type of data that the chart requires. If the data does not meet the minimum requirements based on the type of chart that you are using, an error will be generated.
The following is a list of data requirements for 3D stacked cylinder column charts:
The data set contains one or more numeric columns. A numeric column is any DataColumn containing only values which can be interpreted as numbers.
The columns must contain values that are either all positive, or all negative. All columns of the same row are "stacked" into a vertical column.
If you are binding the 3D stacked cylinder column chart to a series object, see Requirements for Series Binding for information on the series binding requirements.
The chart data is rendered using the following rules:
Each data row is drawn separately as group of columns. These groups of columns are called a series. Each series displays series labels below the x-axis. Data values are represented by the width of the bar along the y-axis.
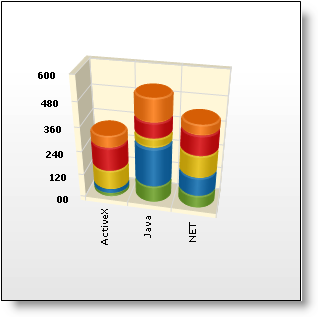
The x-axis (or horizontal axis) is a SetLabelAxis object, with the points evenly spaced apart by series (group) and item (bar). The y-axis (or vertical axis) is the numeric axis. Labels on the y-axis can be formatted using the FormatString property and a numeric format string:
UltraChart.Axis.X.Labels.ItemFormatString = "“<DATA_VALUE:##.##>"See below for an example data set, along with the rendered 3D stacked cylinder column chart.