
This topic discusses useful information that will help you to ensure that your data is rendered properly in the candle chart.
While the Chart control allows you to easily point the chart to your own custom data, it is important that you are supplying the appropriate amount and type of data that the chart requires. If the data does not meet the minimum requirements based on the type of chart that you are using, an error will be generated.
The following is a list of data requirements for candle charts:
The data set contains at least one DateTime column and five numeric columns.
The five numeric columns are named in order: "Open", "High", "Low", "Close", and "Volume". The columns must be in the order. For binding to custom business objects, you have to implement ICustomTypeDescriptor to return the properties in the correct order.
If you are binding the candle chart to a series object, see Requirements for Series Binding for information on the series binding requirements.
If you are using the candle chart in a composite chart, see Axis Requirements for Composite Charts for information on the axis requirements for the chart.
The chart data is rendered using the following rules:
Each row in the data represents a single "candle".
The value in the "Date" column will be used for the label on the x-axis (horizontal axis).
A rectangle will be drawn, using the y-axis to plot the "Open" and "Close" values as the top and bottom of the rectangle.
If the "Open" value is higher than the "Close" value, the NegativeRangeColor will be used to fill the rectangle. If the "Close" value is higher than the "Open" value, the PositiveRangeColor will be used to fill the rectangle.
A vertical line will be drawn, using the y-axis to plot the "High" and "Low" values as the top and bottom of the line. This line is called the "wick".
The content of the Volume column is rendered only if the VolumeVisible property is set to True. (By default, this property is set to False.) The Y2-axis is used to plot volume values. By default, the Y2-axis is not visible, but this can be changed using the UltraChart.Axis.Y2.Visible property.
When binding to a DataTable, you can use CandleSeries to specify explicitly which columns should be used for Open, Close, High, Low and Volume.
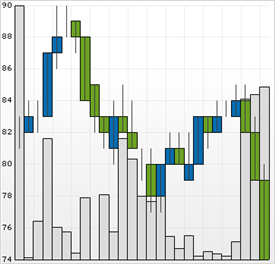
See below for an example data set, along with the rendered candle chart.