
This topic discusses useful information that will help you to ensure that your data is rendered properly in the polar chart.
While the Chart control allows you to easily point the chart to your own custom data, it is important that you are supplying the appropriate amount and type of data that the chart requires. If the data does not meet the minimum requirements based on the type of chart that you are using, an error will be generated.
The following is a list of data requirements for polar charts:
The data set contains two numeric columns.
The data set can also be grouped by column.
If you are binding the polar chart to a series object, see Requirements for Series Binding for information on the series binding requirements.
If you are using the polar chart in a Composite chart, see Axis Requirements for Composite Charts for information on the axis requirements for the chart.
The chart data is rendered using the following rules:
The first column will be displayed as the angle, and the second column will be displayed as the radial distance.
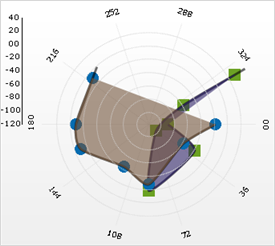
See below for an example data set, along with the rendered polar chart. This data represents cell phone towers' signal strength in various directions by more than one carrier. This data is hypothetical and is simply an example of how the Polar chart is used. The first column represents a cellular service provider company name, followed by angular orientation and signal strength in 'db'.
The data is being grouped by the chart when plotted. AT&T entries are grouped together as are the Verizon entries.