
This topic discusses useful information that will help you to ensure that your data is rendered properly in the radar chart.
While the Chart control allows you to easily point the chart to your own custom data, it is important that you are supplying the appropriate amount and type of data that the chart requires. If the data does not meet the minimum requirements based on the type of chart that you are using, an error will be generated.
The following is a list of data requirements for radar charts:
The data set contains at least three numeric columns.
Each numeric column must contain at least three "spokes" (or axes)
The data set contains at least one or more rows.
If you are binding the radar chart to a series object, see Requirements for Series Binding for information on the series binding requirements.
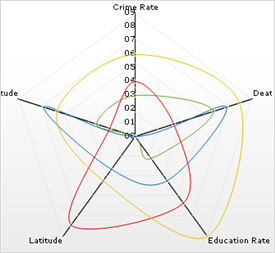
The chart data is rendered using the following rule:
Each numeric column represents a "spoke" (or axis) in the radar chart. If there are multiple rows, each row renders as a new set line connecting the data points on each spoke.
See below for an example data set, along with the rendered radar chart.