UltraChart.Axis.X.Labels.ItemFormatString = "<ITEM_LABEL:MMM dd, yyyy>"
This topic discusses useful information that will help you to ensure that your data is rendered properly in the step area chart.
While the Chart control allows you to easily point the chart to your own custom data, it is important that you are supplying the appropriate amount and type of data that the chart requires. If the data does not meet the minimum requirements based on the type of chart that you are using, an error will be generated.
The following is a list of data requirements for step area charts:
The data set contains all of the following:
one DateTime column
one numeric column
at least one row
If you are binding the step area chart to a series object, see Requirements for Series Binding for information on the series binding requirements.
If you are using the step area chart in a composite chart, see Axis Requirements for Composite Charts for information on the axis requirements for the chart.
The chart data is rendered using the following rules:
The first DateTime column in the data source will be used for the x-axis (horizontal axis) values.
The first numeric column in the data source will be used for the y-axis (vertical axis) values.
Each row is plotted as a single data point in the stepped line, using a coordinate generated by mapping the data values on the x-axis and y-axis.
The x-axis (or horizontal axis) is a time-scale axis, with points spaced out according to a continuous scale of time. Date/Time values on the x-axis can be formatted using the FormatString properties of the x-axis labels and a DateTime format string:
UltraChart.Axis.X.Labels.ItemFormatString = "<ITEM_LABEL:MMM dd, yyyy>"The y-axis (or vertical axis) is the numeric axis. Labels on the y-axis can be formatted using the FormatString properties and a numeric format string:
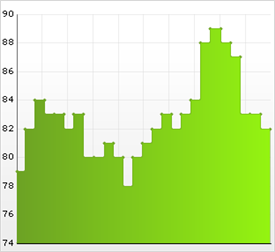
UltraChart.Axis.Y.Labels.ItemFormatString = "<DATA_VALUE:##.##>"See below for an example data set, along with the rendered step area chart.