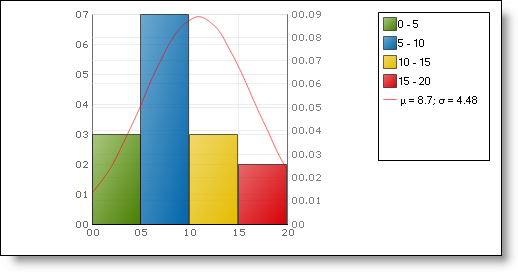
A histogram chart graphically displays a table of tabulated frequencies. A histogram chart is a graphical representation of a table that shows what proportion of results fall into each category. A histogram chart can also display a normal distribution curve for the data.