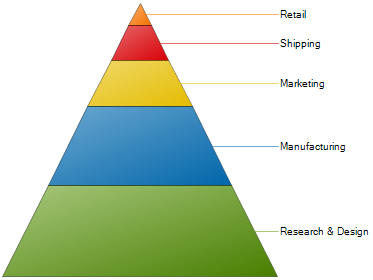
A pyramid chart is a type of chart that displays quantities as percentages of a whole, much like a pie chart. Pyramid charts are commonly used to display quantitative data in relation to stages of a process. For example a pyramid chart might display expenses of a product from the manufacturing stage to the actual sale of that product.