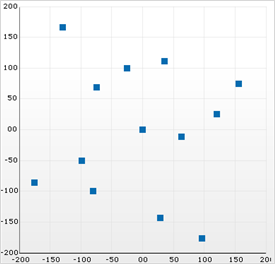
A scatter chart is used either to show the relationship among the items in several distinct series of data, or to plot two sets of values as one series of x/y coordinates. A scatter chart draws attention to uneven intervals or clusters of data. This type of chart is often used to plot scientific data, and can highlight the deviation of collected data from predicted results.
If you want your chart to display data in chronological order, and plot points across the x-axis according to elapsed time, see Display Data on a Time-Scale Axis.