
This topic discusses useful information that will help you to ensure that your data is rendered properly in the gantt chart.
While the Chart control allows you to easily point the chart to your own custom data, it is important that you are supplying the appropriate amount and type of data that the chart requires. If the data does not meet the minimum requirements based on the type of chart that you are using, an error will be generated.
The following is a list of data requirements for gantt charts:
The data set contains either of the following:
DataTable object that consists of both of the following:
two columns that contain DateTime values
two columns that contain string or numeric values
GanttDataSource object that consists of at least one item.
If a DataTable is used, the StartTimeColumnIndex and EndTimeColumnIndex properties must be set to identify the correct column indices to use in the data.
If you are binding the gantt chart to a series object, see Requirements for Series Binding for information on the series binding requirements.
If you are using the gantt chart in a Composite chart, see Axis Requirements for Composite Charts for information on the axis requirements for the chart.
The chart data is rendered using the following rule:
If a DataTable is used as the data source for the gantt chart, there are many columns of information which can be used in addition to the (required) start, end time, series, and task columns.
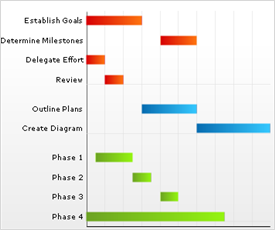
See below for an example data set, along with the rendered gantt chart.
Using the above data set as a model, the following properties must be set in order to load this information into a Gantt chart.
UltraChart.GanttChart.Columns.SeriesLabelsColumnIndex = 0
UltraChart.GanttChart.Columns.ItemLabelsColumnIndex = 1
UltraChart.GanttChart.Columns.StartTimeColumnIndex = 2
UltraChart.GanttChart.Columns.EndTimeColumnIndex = 3
UltraChart.GanttChart.Columns.IDColumnIndex = 4
UltraChart.GanttChart.Columns.LinkToColumnIndex = 5
UltraChart.GanttChart.Columns.PercentCompleteColumnIndex = 6
UltraChart.GanttChart.Columns.OwnerColumnIndex = 7A specialized collection class, GanttDataSource , is provided for the Gantt chart type. If an external data source is not used, or if a more object-oriented, strongly-typed data model is preferred, then working with a GanttDataSource may be the right choice for you. See the example code below.
In Visual Basic:
Imports Infragistics.UltraChart.Data
Dim ganttData As New GanttDataSource()
Dim seriesA As GanttSeries = ganttData.Series.Add("Series A")
Dim task1 As GanttItem = seriesA.Items.Add("Task 1")
task1.Times.Add(DateTime.Parse("11/29/2004 12:00 PM"), _
  DateTime.Parse("12/01/2004 12:00 PM"))
task1.Times(0).ID = 0
task1.Times(0).LinkToID = 1
task1.Times(0).PercentComplete = 100
task1.Times(0).Owner = "Worker A"
Dim task2 As GanttItem = seriesA.Items.Add("Task 2")
In C#:
using Infragistics.UltraChart.Data;
GanttDataSource ganttData = new GanttDataSource();
GanttSeries seriesA = ganttData.Series.Add("Series A");
GanttItem task1 = seriesA.Items.Add("Task 1");
task1.Times.Add(DateTime.Parse("11/29/2004 12:00 PM"),
  DateTime.Parse("12/01/2004 12:00 PM"));
task1.Times[0].ID = 0;
task1.Times[0].LinkToID = 1;
task1.Times[0].PercentComplete = 100;
task1.Times[0].Owner = "Worker A";
GanttItem task2 = seriesA.Items.Add("Task 2");
// etc ...