
This topic discusses useful information that will help you to ensure that your data is rendered properly in the histogram chart.
While the Chart control allows you to easily point the chart to your own custom data, it is important that you are supplying the appropriate amount and type of data that the chart requires. If the data does not meet the minimum requirements based on the type of chart that you are using, an error will be generated.
Histogram charts supports all the data source options as column charts, such as DataSet, DataTable, Multi-Dimensional numeric arrays, and Numeric series.
A histogram chart consists of two main classes:
HistogramLayer — This class takes the data and transforms it into a histogram table.
HistogramAppearance — This class displays the histogram table in the form of a histogram chart.
The chart data is rendered using the following rules:
Columns can represent one of the following:
The number of times a certain value occurs
The number of values that fall within a certain range.
The column is determined by the Axis property, which can be set to either String, which displays one value or Numeric which displays a range of data.
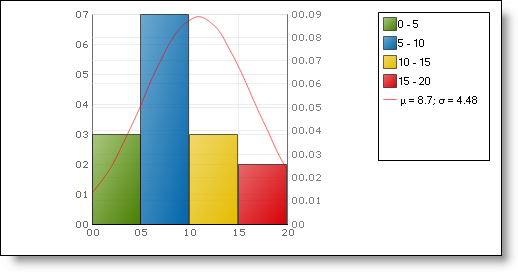
The following example shows how to create a histogram chart. The chart is created with an array of data as the data source and the data bin is set to 5. The distribution curve is displayed by default.
When you save and run your application after completing the following steps, your chart should look similar to the chart below.
To create a histogram chart at design time:
From the toolbox, drag the UltraChart control to your form.
In the Properties window, select the ChartType property. Then, from the drop-down list, select Histogram Chart.
Expand the Axis property, then expand the X Axis property and set the following properties:
TickmarkStyle — DataInterval
TickmarkInterval — 5
RangeMin — 0
RangeMax — 20
RangeType — Custom
Within the X Axis property, expand the Labels property and set the Orientation property to Horizontal.
Expand the HistogramChart property, then expand the ColumnAppearance property and set the following properties:
StringAxis — False
ShowInLegend — True.
Expand the Legend property and set the following properties:
Visible — True
BackgroundColor — Transparent
BorderColor — Black
Margins — (5,5,5,150)
In the load event, bind your chart to an array of data
In Visual Basic:
Me.UltraChart1.Data.DataSource =
  New Integer() {1, 2, 4, 5, 6, 7, 8, 9, 9, 9, 12, 13, 14, 15, 16}
Me.UltraChart1.Data.DataBind()
In C#:
this.ultraChart1.Data.DataSource =
    new int[] { 1, 2, 4, 5, 6, 7, 8, 9, 9, 9, 12, 13, 14, 15, 16 };
this.ultraChart1.Data.DataBind();
Save and run your application.
To create a histogram chart at run time:
Before you start writing any code, you should place using/Imports directives in your code-behind so you don’t need to always type out a member’s fully qualified name.
In Visual Basic:
Imports Infragistics.Win.UltraWinChartImports Infragistics.WebUI.UltraWebChartImports Infragistics.WebUI.UltraWebChart
Imports Infragistics.UltraChart.Resources.Appearance
Imports Infragistics.UltraChart.Shared.Styles
In C#:
using Infragistics.Win.UltraWinChart;using Infragistics.WebUI.UltraWebChart;using Infragistics.WebUI.UltraWebChart
using Infragistics.UltraChart.Resources.Appearance;
using Infragistics.UltraChart.Shared.Styles;
Create an instance of a chart and set the type to HistogramChart.
In Visual Basic:
Dim ultraChart1 As New UltraChart
Me.UltraChart1.ChartType = ChartType.HistogramChart
In C#:
UltraChart ultraChart1 = new UltraChart();
this.ultraChart1.ChartType = ChartType.HistogramChart;
In ColumnAppearance property set the following properties:
StringAxis — False
ShowInLegend — True.
In Visual Basic:
Me.UltraChart1.HistogramChart.ColumnAppearance.StringAxis = False
Me.UltraChart1.HistogramChart.ColumnAppearance.ShowInLegend = True
In C#:
this.ultraChart1.HistogramChart.ColumnAppearance.StringAxis = false;
this.ultraChart1.HistogramChart.ColumnAppearance.ShowInLegend = true;
Set the following properties for the X Axis property:
TickmarkStyle — DataInterval
TickmarkInterval — 5
RangeMin — 0
RangeMax — 20
RangeType — Custom
In Visual Basic:
Me.UltraChart1.Axis.X.TickmarkStyle = AxisTickStyle.DataInterval
Me.UltraChart1.Axis.X.TickmarkInterval = 5
Me.UltraChart1.Axis.X.RangeMin = 0
Me.UltraChart1.Axis.X.RangeMax = 20
Me.UltraChart1.Axis.X.RangeType = AxisRangeType.Custom
In C#:
this.ultraChart1.Axis.X.TickmarkStyle = AxisTickStyle.DataInterval;
this.ultraChart1.Axis.X.TickmarkInterval = 5;
this.ultraChart1.Axis.X.RangeMin = 0;
this.ultraChart1.Axis.X.RangeMax = 20;
this.ultraChart1.Axis.X.RangeType = AxisRangeType.Custom;
In the Labels property of the X Axis property, set the Orientation to Horizontal.
In Visual Basic:
Me.ultraChart1.Axis.X.Labels.Orientation = TextOrientation.Horizontal
In C#:
this.ultraChart1.Axis.X.Labels.Orientation = TextOrientation.Horizontal;
Set the following properties on the Legend property:
Visible — True
BackgroudColor — Transparent
BorderColor — Black
Margins — (5,5,5,150)
In Visual Basic:
Me.ultraChart1.Legend.Visible = True
Me.ultraChart1.Legend.BackgroundColor = System.Drawing.Color.Transparent
Me.ultraChart1.Legend.BorderColor = System.Drawing.Color.Black
Me.ultraChart1.Legend.Margins.Bottom = 150
Me.ultraChart1.Legend.Margins.Left = 5
Me.ultraChart1.Legend.Margins.Right = 5
Me.ultraChart1.Legend.Margins.Top = 5
In C#:
this.ultraChart1.Legend.Visible = true;
this.ultraChart1.Legend.BackgroundColor = System.Drawing.Color.Transparent;
this.ultraChart1.Legend.BorderColor = System.Drawing.Color.Black;
this.ultraChart1.Legend.Margins.Bottom = 150;
this.ultraChart1.Legend.Margins.Left = 5;
this.ultraChart1.Legend.Margins.Right = 5;
this.ultraChart1.Legend.Margins.Top = 5;
Bind your chart to an array of data.
In Visual Basic:
Me.UltraChart1.Data.DataSource =
  New Integer() {1, 2, 4, 5, 6, 7, 8, 9, 9, 9, 12, 13, 14, 15, 16}
Me.UltraChart1.Data.DataBind()
In C#:
this.ultraChart1.Data.DataSource =
    new int[] { 1, 2, 4, 5, 6, 7, 8, 9, 9, 9, 12, 13, 14, 15, 16 };
this.ultraChart1.Data.DataBind();
Save and run your application.