Version

Value Layer

Topic Overview

Purpose

This topic provides information about the ValueLayer series type. It describes the properties of the ValueLayer and provides an example of its implementation.

Required background

The following topics are prerequisites to understanding this topic:

Topic Purpose

The UltraDataChart control requires a data object model to be mapped to control’s DataContext property. This article will provide a simple data object model but you can create your own and use it with this sample code instead.

In this topic

This topic contains the following sections:

Overview

Value Layer Overview

The ValueLayer is a series type that can be added to the UltraDataChart. The purpose of this series type is to annotate different focal points of your data such as the minimum, maximum, or average values by drawing a dashed line at those calculated points.

To determine which focal points you want to annotate, you can set the ValueMode property of the ValueLayer. This property takes one of the ValueLayerValueMode enumerations described below:

  • Auto: The default value mode of the ValueLayerValueMode enumeration.

  • Average: Applies potentially multiple value lines to call out the average value of each series plotted in the chart.

  • GlobalAverage: Applies a single value line to call out the average of all of the series values in the chart.

  • GlobalMaximum: Applies a single value line to call out the absolute maximum value of all of the series values in the chart.

  • GlobalMinimum: Applies a single value line to call out the absolute minimum value of all of the series values in the chart.

  • Maximum: Applies potentially multiple value lines to call out the maximum value of each series plotted in the chart.

  • Minimum: Applies potentially multiple value lines to call out the minimum value of each series plotted in the chart.

You can configure the ValueLayer to target a specific series if you want to have multiple layers present with different configurations. This can be done be setting the TargetSeries property on the layer.

Preview

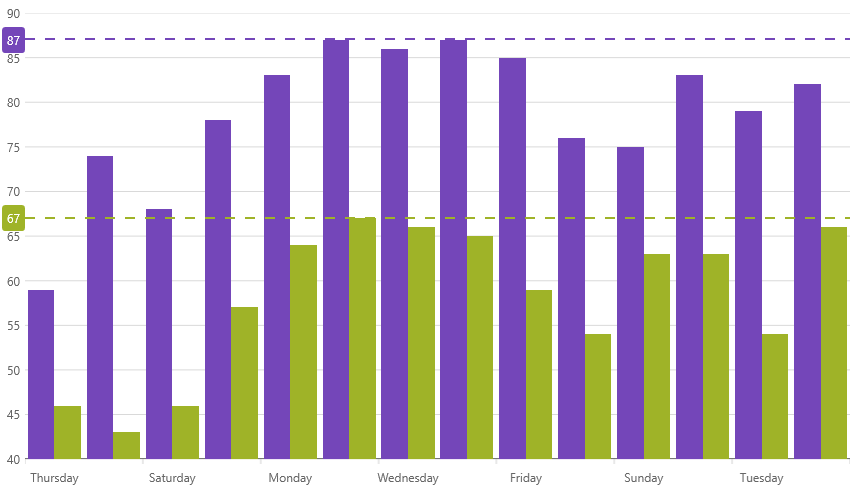
The following image is a preview of the UltraDataChart control with the ValueLayer added with a Maximum ValueMode applied.

datachart valuelayer.png

Properties

Value Layer Summary

The following table summarizes the properties of the ValueLayer layer.

Property Name Property Type Description

bool

Determines whether or not an annotation on the axis should be visible for each of the value layer lines.

Series

The series that the ValueLayer lines should take into account when determining the placement of the lines for the ValueMode.

The type of ValueLayer lines that should be applied.

Example

Following is the code used in the screenshot above.

Topic Purpose

This topic provides information about the properties and methods that the interaction feature uses for highlighting, and interacting with the tooltip interactions inherited from the Series class.

This topic provides information about the crosshair layer used for interactions. It describes the properties of the crosshair layer and provides an implementation example.

This topic provides information about the category item highlight layer used for interactions. It describes the properties of the category item highlight layer and provides an example of its implementation.

This topic provides information about the category tooltip layer used for interactions. It describes the properties of the category tooltip layer and provides an example of its implementation.

This topic provides information about the item tooltip layer which is used for interactions. It describes the properties of the item tooltip layer and also provides an example of its implementation.