Version

UltraSparkline Features

Purpose

This topic provides an overview of the configurable visual elements of UltraSparkline™ control and the features that manage these visual elements.

Required background

The following table lists the topics required as a prerequisite to understanding this topic.

Topic Purpose

This topic provides an overview of the UltraSparkline control, its benefits, and the supported chart types.

Introduction

Introduction to the UltraSparkline visual elements and features

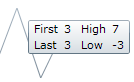
The UltraSparkline control has several visual elements and corresponding features through which these elements can be configured and customized. The primary benefit of Sparkline compared to other charting controls is that it can render in a limited space such as a grid cell with all its visual elements shown. With that in mind, the Sparkline cannot display every label of the data points. It only allows showing high and low values on Y axis, and first and last values on X axis.

The Sparkline has the ability to mark the data points with elliptical icons to indicate the highest, lowest, first, last and negative values. The markers can be customized with a desired

It allows displaying the (X/Y) axis, which takes up the space from the chart by decreasing the chart size in order to accommodate area for the axis and labels.

Configurable Visual Elements of UltraSparkline and Related Properties

Configurable visual elements summary

The following screenshot depicts the visual elements of the UltraSparkline control. The elements that are configurable through properties are listed below. None of these visual elements is displayed by default.

Sparkline Visual Elements 1.png

Configurable Visual Elements:

  • Markers

  • Trend Line

  • Normal Range

  • Unknown Values

  • Axis

  • Tooltip

Configurable visual elements and related properties

The following table maps the visual elements of the UltraSparkline control and the properties that configure them.

Visual Element Property

Markers

Trend Line

Normal Range

Plotted or Unplotted Unknown Value

Axis

Tooltip

Tooltip

UltraSparkline Features Summary

Features summary chart

The following table summarizes the main features of the UltraSparkline control. The features are explained in further detail in the text blocks following the table.

Feature Description
Sparkline Visual Elements 2.png

Markers are symbols overlaid on the Sparkline to indicate the individual data points based on X/Y coordinates.

Sparkline Visual Elements 3.png

Trend lines are lines drawn from the starting point to the end point indicating the trending direction and movement of the series, so that the viewer can evaluate the tendencies in the data and mentally extrapolate past, future, or unknown values.

Sparkline Visual Elements 4.png

The Normal range is a horizontal stripe representing some pre-defined meaningful range when the data is being visualized.

Sparkline Visual Elements 5.png

UltraSparkline can detect unknown values ( null or double.NaN ) and render the space for the unknown values using a specified interpolation algorithm.

Sparkline Visual Elements 6.png

UltraSparkline allows displaying the X and Y axes (both or only one of them) with corresponding labels.

Sparkline Visual Elements 7.png

UltraSparkline can display a tooltip when the mouse is hovered over the Sparkline.

Markers

Markers overview

Markers are symbols overlaid on a single data point to indicate the individual data points plotted on the chart based on the X/Y coordinates.

Sparkline Visual Elements 8.png

The Markers in UltraSparkline can be specified to identify the data points based on the data and/or the location of the data points.

Marker types

The following table displays the supported Marker types.

Marker type Description

All data points

Sparkline Visual Elements 9.png

Markers are displayed on all data points.

First and last data points

Sparkline Visual Elements 10.png

Two markers are displayed – on the first and on the last data point.

Top and bottom data points

Sparkline Visual Elements 11.png

Two markers are displayed – on the highest and on the lowest data point.

Negative data points

Sparkline Visual Elements 12.png

Markers are displayed on the negative data points. If there is more than one negative data point, all of them will be marked.

Trend Line

Trend Line overview

Trend lines are lines drawn from the starting point to the end point indicating the trending direction and movement of the series, so that the viewer can evaluate the tendencies in the data and mentally extrapolate past, future, or unknown values.

Sparkline Visual Elements 13.png

The Trend Line feature enables you to choose among several formulas for generating a trending directional line. The formula to use is specified in the TrendLineType property. The Trend Line renders in front of the series data so it is always visible.

Supported trend line types

The following table displays the supported trend line types. Each trend line type is drawn based on the calculation formula of its type.

Trend Line type Description TrendLineType

Simple Average

Sparkline Visual Elements 14.png

SimpleAverage is a set of numbers, each of which is the average of a corresponding subset of data points. Also known as Simple Moving Average

SimpleAverage

Modified Average

Sparkline Visual Elements 15.png

Modified Average shows the moving average value over a set period. Used to emphasize the direction of the trend and smooth out the fluctuation.

ModifiedAverage

Exponential Average

Sparkline Visual Elements 16.png

Exponental Average is similar to simple average with weight factor added to it. This type of average is known to react faster to recent changes of the trend.

ExponentialAverage

Cumulative Average

Sparkline Visual Elements 17.png

Cumulative Average is an ordered data points with calculated average of all data up to the current point.

CumulativeAverage

Weighted Average

Sparkline Visual Elements 18.png

Weighted Average is any average that has multiplying factor to give weight to data at different positions.

WeightedAverage

Cubic Fit

Sparkline Visual Elements 19.png

Uses polynomial mathematical functions to specify a cubic fit trend line on a series.

CubicFit

Exponential Fit

Sparkline Visual Elements 20.png

Uses exponential mathematical functions to specify an exponential fit trend line on a series.

ExponentialFit

Line Fit

Sparkline Visual Elements 21.png

The best-fiting straight trend line.

LineFit

Logarithmic Fit

Sparkline Visual Elements 22.png

The best-fitting curved line. Used when the rate of change in the data increases or decreases quickly and then levels out. This type of trend line is most useful with sufficient data.

LogarithmicFit

Power Low Fit

Sparkline Visual Elements 23.png

Power Low trend line is a curved line that uses power function to draw a line. It is best to avoid zero (0) point as it is not valid for power function. Sparkline will not produce any errors, it will plot the o point, but from the power trend line prospective the result will not be accurate. Power trend line is used with data sets that compare measurements that increase at a specific rate.

PowerLowFit

Quadratic Fit

Sparkline Visual Elements 24.png

Uses quadratic equation to form a trend line. It shows the overall effect of the high and low data points with the accuracy of a linear curve.

QuadraticFit

Quartic Fit

Sparkline Visual Elements 25.png

Uses quartic polynomial to specify a trend line on series.

QuarticFit

Quintic Fit

Sparkline Visual Elements 26.png

Uses quintic polynomial to specify a trend line on a series.

QuinticFit

Normal Range

Normal Range overview

The Normal Range is a horizontal stripe drawn to represent some pre-defined meaningful range when the data is being visualized.

Sparkline Visual Elements 4.png

The typical use of the Normal Range is to indicate what values are considered normal or good. For example, if the Sparkline represented the person’s heart rate over time, the normal range of 60-100 beats per minute would be the range to be highlighted as Normal, and the data points outside of this range would be easy to identify.

The range width and position is determined by the NormalRangeMinimum and NormalRangeMaximum properties.

Interpolating Unknown Values

Interpolating Unknown Values overview

The UltraSparkline can detect unknown values and render the space for the unknown values using a specified interpolation algorithm.

If there are missing values in the data (typical “unknown” values found in data are null and double.NaN ), UltraSparkline can render in the space with unknown values by linear interpolation. The following table demonstrates the difference in a Sparkline plotted from the same data set (containing missing values) without using Unknown Values Plotting and with it.

Plotting of unknown values applied? Preview

No

Sparkline Visual Elements 28.png

Yes

Sparkline Visual Elements 29.png

This feature is managed through the UnknownValuePlotting property. The allowed values are DontPlot and LinearInterpolate .

Supported Sparkline types

The following Sparkline types support Unknown Values Plotting:

  • Area

  • Line

The Column and Win/Loss types do not interpolate unknown values. These Sparkline types will always display a blank space where unknown values are present.

Axes

Axes overview

The Sparkline allows displaying the X and Y axes (both or only one of them) with corresponding labels.

Sparkline Visual Elements 30.png
Sparkline Visual Elements 31.png
Sparkline Visual Elements 32.png

Axes customization

The axes of the UltraSparkline control can be customized in the following aspects:

  • Visibility

The visibility of the X and Y axis are managed by separate properties ( HorizontalAxisVisibility and VerticalAxisVisibility, respectively) so it is possible to have only one of them displayed.

  • Label

    • Label text

You can add descriptive labels to the X axis. This capability is managed by the LabelMemberPath property.

  • Label font

The label fonts can be customized using the typical font-related control properties: Foreground, FontFamily, FontSize, FontStyle, and FontStretch. Therefore, it is not possible to use a different font for each axis.

Tooltip

Tooltip overview

The UltraSparkline can display a tooltip when the mouse is hovered over the Sparkline. The tooltip is designed to display the high, low, first, and last data points.

Sparkline Visual Elements 33.png

The following topics provide additional information related to this topic.

Topic Purpose

This topic provides an overview of the UltraSparkline control, its benefits, and the supported chart types.

This topic provides an overview of the possible ways to configure the UltraSparkline™ control. Links to the detailed configurations (available in separate topics) are provided as well.

This topic explains the featured properties of the UltraSparkline™ control.