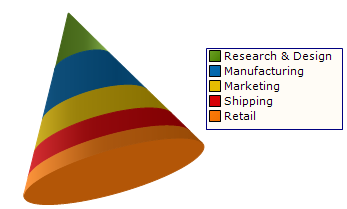

The 3D Cone chart is one of a number of new charts in the 2006 Volume 2 release. Like the Pyramid chart, the Cone chart (also known as the Rounded Pyramid chart) is useful for comparing data. With the 3D Cone chart, your end users can quickly determine the significance of each data set by viewing the height of each cone segment in relation to the other cone segments and the entire cone.