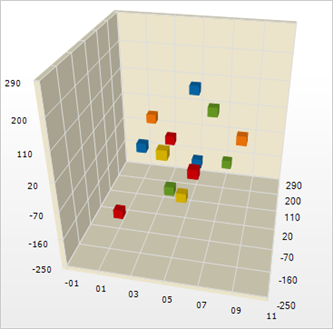

The 3D Point chart is based on our existing Scatter chart, which essentially shows the relationship between numeric values in distinct series of data, thus providing useful information for scientific and predictive analysis. The 3D Point chart goes a step beyond the Scatter chart by adding another dimension (z-axis) to the chart. This gives striking depth to the icons displayed in the chart.