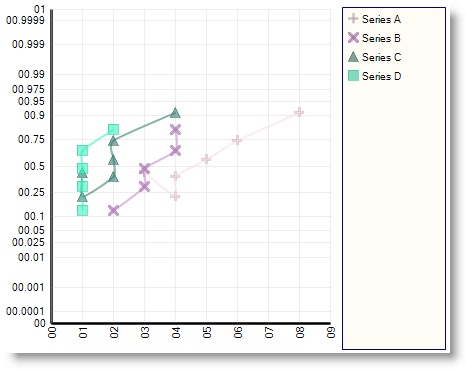

In the 2006 Volume 1 release, we added the Probability Chart to our suite of chart types. The Probability Chart is a modified version of the Scatter Chart, which uses Gaussian distribution (also known as Normal distribution) on its Y-axis.
Probability charts allow end users to interpret the likelihood of an occurrence of an event, action or item. They are useful for visually verifying the actual distribution of data points, compared to the predicted distribution (Gaussian bell curve).