
To make your line charts and area charts even more representative and informative, we have provided new settings that you can enable separately for each series of your chart. These settings can be applied to the following types of 2D line and spline charts:
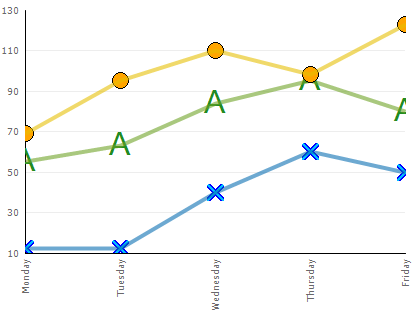
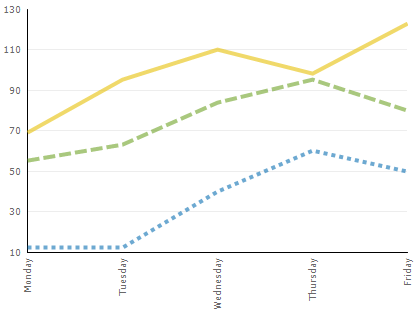
Previously, when a LineDrawStyle (e.g., Solid, Dash, Dot) was applied to a Line chart, it was applied on a chart-wide basis. Starting in 2006 Volume 3, you can set a style for each series of a line or spline chart, allowing each series to be visually unique. For example, if you want to display rainfall amounts in four cities over a period of one month in your 2D Stacked Line chart, you can set a different draw style for each series of the chart.
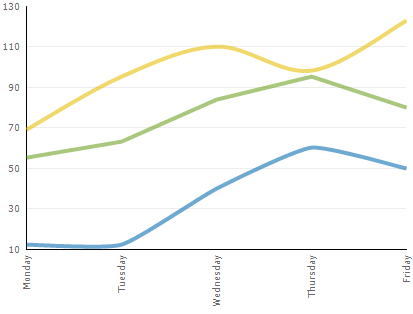
To change how tightly the spline curve fits through the data points of your chart, you must set the SplineChartAppearance.SplineTension property. Now, in the 2006 Volume 3 release, you can set the spline tension for each series of your chart by setting the new LineAppearance.SplineTension property. For example, if your Spline chart displays the rise and fall of stock prices in various companies over a period of time, you can differentiate between each series of stock prices by increasing or decreasing the spline tension value for each series.
Previously, line and spline charts allowed only a small midpoint anchor at each vertex of a line. Starting in the 2006 Volume 3 release, you can specify a different icon for the anchor points of each line in your chart. Furthermore, you can even use custom icons that uniquely identify each series of your chart. By customizing the appearance of icons for the chart’s line points, you can improve the readability of the data for your end users.