
If your chart plots date/time data on a time-scale axis, you can generate the following types of date/time intervals:
Percentage intervals — A line Tickmark is shown every n % along the X-axis from the start date to the end date.
Numeric intervals – A number of lines or Tickmarks are shown every n ticks from the start date to the end date.
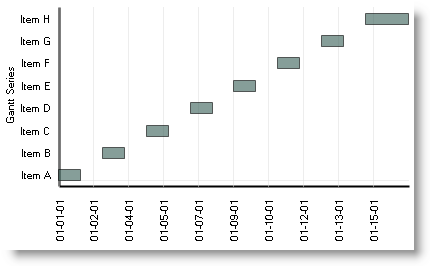
By default, the date/time interval is set to Percentage, and the value is 10. Therefore, a Tickmark on the chart will appear at every 10% of the range of data. Considering that standard units of time are not based on 10, labels on a time-scale axis would seem illogical. Notice in the example Gantt chart below that there are certain dates missing along the X-axis.
To address this issue, we have improved the logic of date/time intervals in charts that use a time-scale axis. Now you can take advantage of "smart Tickmarks" to allow the Chart control to generate Tickmarks using logical intervals of time (e.g., days, weeks, or months). The example Gantt chart below is using a time-scale axis.
