
You can use Linear gauges to visually represent information that increases/decreases (e.g., temperature).
To add a Linear gauge to the WinGauge control:
In Design view, click the UltraGauge control on your form.
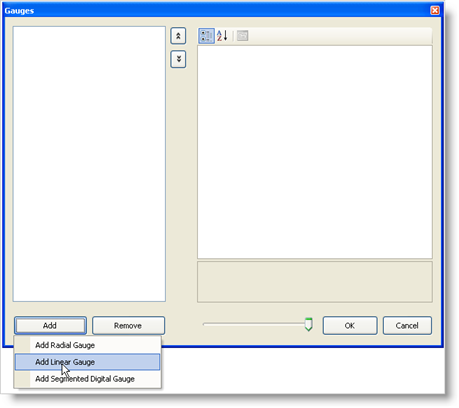
In the Properties window, click the Gauges property. Then, click the ellipsis (…) button to open the Gauges collection editor.
In the Gauges collection editor, click Add, and select Add Linear Gauge.
At this point, the Linear Gauge has been added, but it is not visible because you haven’t set specific properties. To start configuring the Gauge, expand the Misc property.
Create a new BrushElement object by clicking the BrushElement property. Then from the drop-down list, select Solid Fill.
Expand the BrushElement property, and set the Color property to Silver.
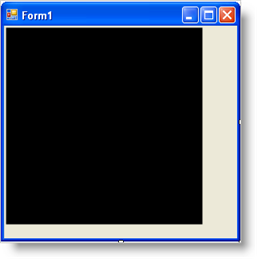
At this point, you should see the Linear gauge.
Resize the gauge by expanding the Bounds property. Set the Width property to 250, and the Height property to 100\.
Create a new Scale by clicking the Scales property . Then click the ellipsis (…) button to open the Scale cCollection editor.
Click Add to create a new Scale.
Create a new Axis object by clicking the Axis property of the Scale. Then, from the drop-down list, select Numeric Axis.
Expand the Axis property, and set the StartValue property to 0. Then set the EndValue property to 100\.
Add major tick marks to the Scale by expanding the MajorTickmarks property. Then, create a new brush element by clicking the BrushElement property, and from the drop-down list, selecting Solid Fill.
Expand the BrushElement property, and set the Color property to White.
In order to align the outer edge of the tick marks, set the EndExtent property to 55.
You must also change the StartExtent property so that its value is less than the EndExtent property. Set the StartExtent property to 45.
Set the StartWidth property to 2 and the EndWidth property to 2.
Set the stroke element of the major tick marks by expanding the StrokeElement property, and setting the color to Gray.
Add minor tick marks to the scale by expanding the MinorTickmarks property.
Expand the StrokeElement property, and set the Color property to Black.
In order to align the outer edge of the tick marks, set the EndExtent property to 50\.
You must also change the StartExtent property so that its value is less than the EndExtent property. Set the StartExtent property to 45.
Set the StartWidth property to 1, the EndWidth property to 1 and the Frequency property to 0.2.
Add a label to the scale by expanding the Label property. Then, create a new brush element by clicking the BrushElement property, and from the drop-down list, selecting Solid Fill.
Expand the BrushElement property, and set the Color property to White.
Set the Extent property to 65 and the ZPosition property to AboveMarkers.
Now all that is needed is a marker that indicates the current value that should be displayed. Click the Markers property of the scale, and click the ellipsis (…) button to open the Markers collection editor.
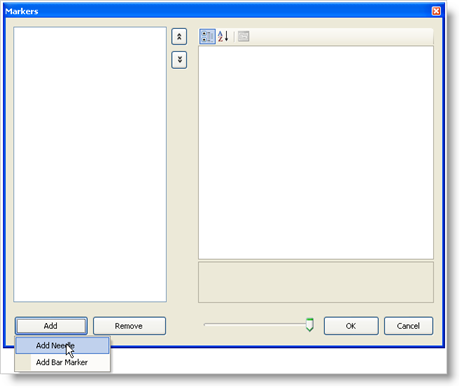
Click Add and select Add Needle.
The needle has now been added but is not visible because you have not created a brush element.
Create a new BrushElement object by clicking the BrushElement property. Then from the drop-down list, select Solid Fill.
Expand the BrushElement property, and set the Color property to Gray.
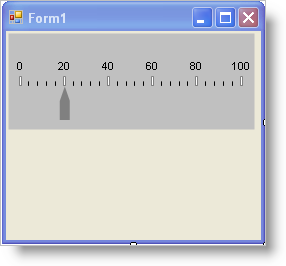
The needle is still not visible because you have not specified its value. Set the Value property to 20\.
Set the StartExtent property to 10, the EndExtent property to 45, and the MidExtent MidExtent property to 30\.
Run the project. It should look similar to the form below.