
This topic introduces custom axis tickmark values feature of the XamDataChart™ control and explains, with code examples, how to use it to create custom tickmark values for a numeric axis.
The topic is organized as follows:
The XamDataChart control is designed to allow application developers to implement custom axis tickmark values in their applications. This is accomplished by setting the TickmarkValues property of a numeric axis (e.g. NumericYAxis) to an object that inherits from abstract class called TickmarkValues.
Refer to the Chart Axes topic for more information on axes in the XamDataChart control.
Table 1 – List of types of axes that support custom axis tickmark values.
Table 2 – API overview of axis properties related to tickmark values.
The TickmarkValues is an abstract class that provides override-able methods for defining custom tickmark values.
Table 3 – API overview of override-able methods in TickmarkValues class.
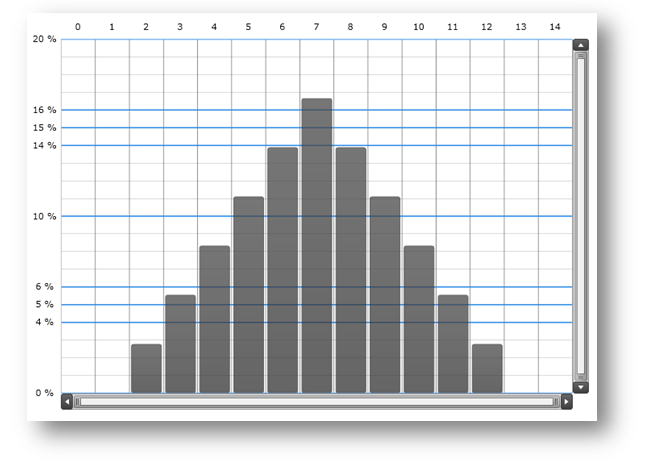
An example of an object that defines custom tickmark values is CustomTickmarkValues. This object defines positions of major tickmarks at: 0, 4, 5, 6, 10, 14, 15, 16, 20, and minor tickmarks at intervals of one.
Figure 1 – Preview of the XamDataChart control with CustomTickmarkValues set to y-axis.
The following code snippet shows how to create custom CustomTickmarkValues that defines custom positions for major and minor tickmarks.
In Visual Basic:
Imports Infragistics.Controls.Charts

Namespace Infragistics.Samples.Common
    Public Class CustomTickmarkValues
        Inherits TickmarkValues
        Public Sub New()
            ' define custom tickmark values
            Me.Tickmarks = New DoubleCollection() From { 0.0, 4.0, 5.0, 6.0, 10.0, 14.0, 15.0, 16.0, 20.0 }
        End Sub

        Protected First As Double
        Protected Last As Double
        Protected Tickmarks As DoubleCollection

        ''' <summary>
        ''' Initializes tickmark values prior to rendering axis labels, strip bars, and gridlines
        ''' </summary>
        ''' <param name="initializationParameters"></param>
        Public Overrides Sub Initialize(initializationParameters As TickmarkValuesInitializationParameters)
            MyBase.Initialize(initializationParameters)
            ' Initialize is overridden in order to store the minimum and maximum values,
            ' which will be later used in the MajorValues() and MinorValues() methods.
            Me.First = initializationParameters.VisibleMinimum
            Me.Last = initializationParameters.VisibleMaximum
        End Sub

        ''' <summary>
        ''' Returns values of major tickmarks
        ''' </summary>
        ''' <returns></returns>
        Public Overrides Function MajorValues() As IEnumerable(Of Double)
            Dim values As IEnumerable(Of Double) = Tickmarks.Where(Function(value) value >= Me.First AndAlso value <= Me.Last)
            Return values
        End Function

        ''' <summary>
        ''' Returns values of minor tickmarks
        ''' </summary>
        ''' <returns></returns>
        Public Overrides Function MinorValues() As IEnumerable(Of Double)
            Dim start As Double = Me.First
            Dim minorValue As Double = start
            While minorValue < Me.Last
                yield Return minorValue
                minorValue += 1.0
            End While
        End Function
    End Class
End Namespace
In C#:
using Infragistics.Controls.Charts;

namespace Infragistics.Samples.Common
{
    public class CustomTickmarkValues : TickmarkValues
    {
        public CustomTickmarkValues()
        {
            // define custom tickmark values
            this.Tickmarks = new DoubleCollection { 0.0, 4.0, 5.0, 6.0, 10.0, 14.0, 15.0, 16.0, 20.0 };
        }

        protected double First;
        protected double Last;
        protected DoubleCollection Tickmarks;

        /// <summary>
        /// Initializes tickmark values prior to rendering axis labels, strip bars, and gridlines
        /// </summary>
        /// <param name="initializationParameters"></param>
        public override void Initialize(TickmarkValuesInitializationParameters initializationParameters)
        {
            base.Initialize(initializationParameters);
            // Initialize is overridden in order to store the minimum and maximum values,
            // which will be later used in the MajorValues() and MinorValues() methods.
            this.First = initializationParameters.VisibleMinimum;
            this.Last = initializationParameters.VisibleMaximum;
        }

        /// <summary>
        /// Returns values of major tickmarks
        /// </summary>
        /// <returns></returns>
        public override IEnumerable<double> MajorValues()
        {
            IEnumerable<double> values = Tickmarks.Where((value) => value >= this.First && value <= this.Last);
            return values;
        }

        /// <summary>
        /// Returns values of minor tickmarks
        /// </summary>
        /// <returns></returns>
        public override IEnumerable<double> MinorValues()
        {
            double start = this.First;
            for (double minorValue = start; minorValue < this.Last; minorValue += 1.0)
            {
                yield return minorValue;
            }
        }
    }
}
The following code snippet shows how to set custom CustomTickmarkValues to the y-axis in the XamDataChart control.
In XAML:
<ig:XamDataChart.Axes>
    <ig:NumericYAxis Name="yAxis" Label="{}{} %" >
        <!-- ========================================================================== -->
        <ig:NumericYAxis.TickmarkValues>
            <common:CustomTickmarkValues />
        </ig:NumericYAxis.TickmarkValues>
        <!-- ========================================================================== -->
    </ig:NumericYAxis>
</ig:XamDataChart.Axes>