
This topic introduces Series Data Correlation feature of the XamDataChart™ control and explains how to use it with code examples.
The topic is organized as follows:
Assembly Requirements
Data Requirements
Preview
Procedure
The Series Data Correlation is an integration of the XamDataChart control with the CorrelationCalculator that allows for the calculation of the correlation between two values in a data set displayed using the ScatterSeries. Data Correlation is useful for identifying how two variables in the data set are related to each other. For example, you can use correlation to determine if there is a connection between high blood pressure readings and the age group of patients plotted in the XamDataChart control. Refer to the Infragistics Math Calculators topic for more information about the CorrelationCalculator and the different types of data correlation.
This section provides prerequisites for working with the Series Data Correlation feature of the XamDataChart control.
Table 1 – List of NuGet packages that need to be added to a WPF project.
The CorrelationCalculator requires data object that must implement the IEnumerable interface (e.g. List, Collection, Queue, Stack) and items of this object must consist of two numeric data columns on which data correlation is calculated. Furthermore, these two data columns must be mapped to XMemberPath and YMemberPath properties of the CorrelationCalculator and the ScatterSeries objects.
An example of an object that meets the above criteria is the CorrelationDataSample, which you can download from the Correlation Data Sample resource and use it in your project.
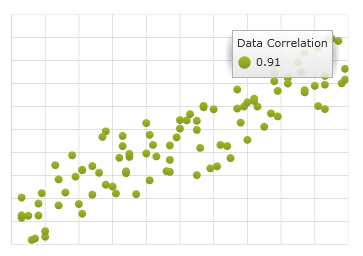
The following example demonstrates how to calculate correlation of data bound to the ScatterSeries in the XamDataChart control and display the result as title of the series in a legend of the chart. It assumes that you added all required assemblies listed in the Assembly Requirement section to your project.
Figure 1 – Sample integration of the XamDataChart control with CorrelationCalculator
This procedure provides steps necessary for integrating the XamDataChart control with CorrelationCalculator and displaying the result of calculation.
Add Correlation Data Sample object as data source that will provide data for calculating correlation.
In XAML:
xmlns:local="clr-namespace:Infragistics.Samples.Data.Models"
In XAML:
<local:CorrelationDataSample x:Key="Data">
    <local:CorrelationDataSample.Settings>
        <local:CorrelationDataSettings DataDistribution="RandomlyIncreasing" />
    </local:CorrelationDataSample.Settings>
</local:CorrelationDataSample>
In Visual Basic:
Imports Infragistics.Samples.Data.Models
...
Dim data As New CorrelationDataSample()
data.Settings = New CorrelationDataSettings()
data.Settings.DataDistribution = DataDistribution.RandomlyIncreasing
In C#:
using Infragistics.Samples.Data.Models;
...
CorrelationDataSample data = new CorrelationDataSample();
data.Settings = new CorrelationDataSettings();
data.Settings.DataDistribution = DataDistribution.RandomlyIncreasing;
Create instance of the CorrelationCalculator with appropriate data bindings.
In XAML:
xmlns:ig="http://schemas.infragistics.com/xaml"
xmlns:igMath="http://schemas.infragistics.com/xaml"
In XAML:
<ig:CorrelationCalculator x:Key="correlationCalc"
                          XMemberPath="X" YMemberPath="Y"
                          ItemsSource="{StaticResource Data}" />
In Visual Basic:
Imports Infragistics.Math.Calculators
...
Dim correlationCalc As New CorrelationCalculator()
correlationCalc.XMemberPath = "X"
correlationCalc.YMemberPath = "Y"
correlationCalc.ItemsSource = data
In C#:
using Infragistics.Math.Calculators;
...
CorrelationCalculator correlationCalc = new CorrelationCalculator();
correlationCalc.XMemberPath = "X";
correlationCalc.YMemberPath = "Y";
correlationCalc.ItemsSource = data;
Bind Title property of ScatterSeries object to the Value property of the CorrelationCalculator resource. Alternatively, you can display the result of data correlation in other controls (e.g. TextBlock) through binding to a static resource.
In XAML:
<Grid >
    <ig:XamDataChart x:Name="DataChart" Legend="{Binding ElementName=Legend1}" Margin="5">
        <ig:XamDataChart.Axes>
            <ig:NumericXAxis x:Name="xAxis" />
            <ig:NumericYAxis x:Name="yAxis" />
        </ig:XamDataChart.Axes>
        <ig:XamDataChart.Series>
            <!-- ========================================================================== -->
            <ig:ScatterSeries Title="{Binding Value, Source={StaticResource correlationCalc}}"
                              ItemsSource="{StaticResource Data}"
                              XMemberPath="X" YMemberPath="Y"
                              XAxis="{Binding ElementName=xAxis}"
                              YAxis="{Binding ElementName=yAxis}">
            </ig:ScatterSeries>
            <!-- ========================================================================== -->
        </ig:XamDataChart.Series>
    </ig:XamDataChart>
    <ig:Legend x:Name="Legend1" Content="Data Correlation"
               VerticalAlignment="Top" HorizontalAlignment="Right" Margin="10"/>
</Grid>
In Visual Basic:
Imports Infragistics.Controls.Charts
...
Dim binding As New Binding()
binding.Source = correlationCalc
binding.Path = New PropertyPath("Value")
binding.Mode = BindingMode.OneWay
...
Dim series As ScatterSeries = Me.DataChart.Series.OfType(Of ScatterSeries)().First()
series.SetBinding(Series.TitleProperty, binding)
In C#:
using Infragistics.Controls.Charts;
...
Binding binding = new Binding();
binding.Source = correlationCalc;
binding.Path = new PropertyPath("Value");
binding.Mode = BindingMode.OneWay;
...
ScatterSeries series = this.DataChart.Series.OfType<ScatterSeries>().First();
series.SetBinding(Series.TitleProperty, binding);