
This topic introduces the Error Bars feature of the XamDataChart™ control and explains, with code examples, how to display error bars on supported series.
The topic is organized as follows:
Category Series
Scatter Series
Fixed Value Error Bars
Percentage Error Bars
Standard Error Bars
Standard Deviation Error Bars
Custom Data Error Bars
Category Error Bars Properties
Scatter Error Bars Properties
Category Series with Fixed Value Error Bars
Category Series with Percentage Error Bars
Category Series with Standard Error Bars
Category Series with Standard Deviation Error Bars
Category Series with Custom Data Error Bars
Scatter Series with Fixed Value Error Bars
Scatter Series with Percentage Error Bars
Scatter Series with Standard Error Bars
Scatter Series with Standard Deviation Error Bars
Scatter Series with Custom Data Error Bars
Error bars are visual representation of the variability of data plotted in the Data Chart using Series objects. They are often used on charts to show an error or uncertainty in data. In general, they provide visualization of how accurate data measurements are or how far the true values could be from the measured values.
In XamDataChart, the length of error bars is calculated using the Infragistics Math Calculators™ and the following NuGet packages must be added to a WPF project before error bars can be displayed on data points.
This section provides a list of series types that support error bars in the Data Chart control.
Table 1 – Supported Types of Series
The Data Chart supports a number of types of error bars that are listed in the Table 2 below. The length of error bars is calculated using the Infragistics Math Calculators that implements the IErrorBarCalculator interface.
Table 2 – Types of Error Bars
The following table provides overview of properties relevant to error bars for all series in the Category Series group.
The following table provides overview of properties relevant to error bars for all series in the Scatter Series group.
This section provides code examples for displaying various types of error bars on series in the Data Chart control.
The following code listing demonstrates how to display the Fixed Value Error Bars on the LineSeries.
In XAML:
xmlns:ig="http://schemas.infragistics.com/xaml"
xmlns:igCalc=http://schemas.infragistics.com/xaml
In XAML:
<ig:LineSeries.ErrorBarSettings>
    <ig:ScatterErrorBarSettings EnableErrorBars="Both" >
        <ig:CategoryErrorBarSettings.Calculator>
            <igCalc:FixedValueCalculator Value="10" />
        </ig:CategoryErrorBarSettings.Calculator>
    </ig:ScatterErrorBarSettings>
</ig:LineSeries.ErrorBarSettings>
In Visual Basic:
Imports Infragistics.Controls.Charts
Imports Infragistics.Math.Calculators
'...
Dim barsSettings As New CategoryErrorBarSettings()
barsSettings.EnableErrorBars = EnableErrorBars.Both
barsSettings.Calculator = New FixedValueCalculator()
barsSettings.Calculator.Value = 10.0
'...
Dim series As New LineSeries()
'...
series.ErrorBarSettings = barsSettings
In C#:
using Infragistics.Controls.Charts;
using Infragistics.Math.Calculators;
//...
CategoryErrorBarSettings barsSettings = new CategoryErrorBarSettings();
barsSettings.EnableErrorBars = EnableErrorBars.Both;
barsSettings.Calculator = new FixedValueCalculator();
barsSettings.Calculator.Value = 10.0;
//...
LineSeries series = new LineSeries();
//...
series.ErrorBarSettings = barsSettings;
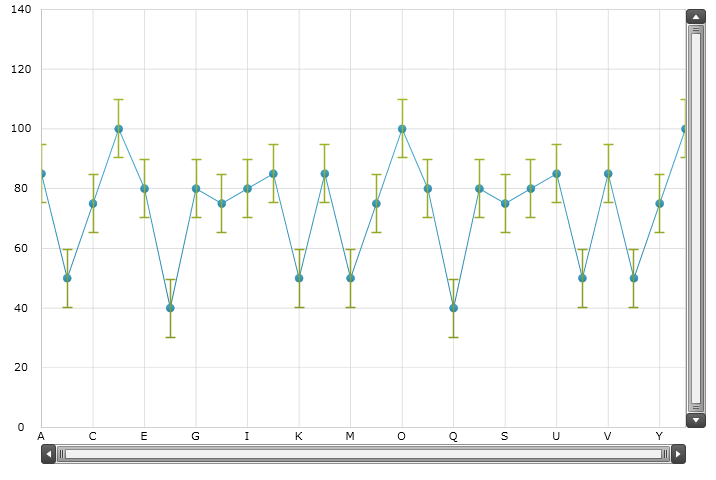
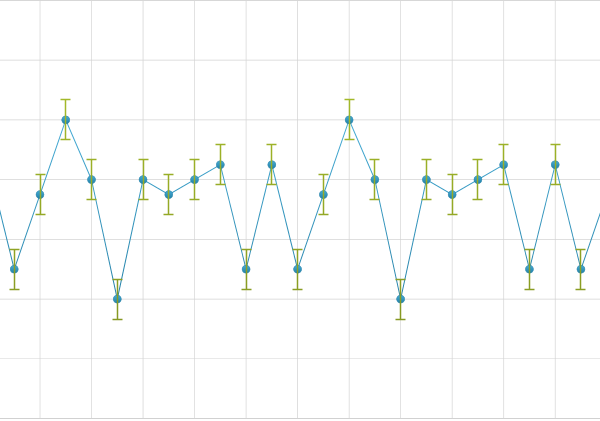
Figure 3 - Line Series with the Fixed Value Error Bars
The following code listing demonstrates how to display the Percentage Error Bars on the LineSeries.
In XAML:
<ig:LineSeries.ErrorBarSettings>
    <ig:ScatterErrorBarSettings EnableErrorBars="Both" >
        <ig:CategoryErrorBarSettings.Calculator>
            <igCalc:PercentageCalculator Value="10" />
        </ig:CategoryErrorBarSettings.Calculator>
    </ig:ScatterErrorBarSettings>
</ig:LineSeries.ErrorBarSettings>
In Visual Basic:
Imports Infragistics.Controls.Charts
Imports Infragistics.Math.Calculators
'...
Dim barsSettings As New CategoryErrorBarSettings()
barsSettings.EnableErrorBars = EnableErrorBars.Both
barsSettings.Calculator = New PercentageCalculator()
barsSettings.Calculator.Value = 10.0
'...
Dim series As New LineSeries()
'...
series.ErrorBarSettings = barsSettings
In C#:
using Infragistics.Controls.Charts;
using Infragistics.Math.Calculators;
//...
CategoryErrorBarSettings barsSettings = new CategoryErrorBarSettings();
barsSettings.EnableErrorBars = EnableErrorBars.Both;
barsSettings.Calculator = new PercentageCalculator();
barsSettings.Calculator.Value = 10.0;
//...
LineSeries series = new LineSeries();
//...
series.ErrorBarSettings = barsSettings;
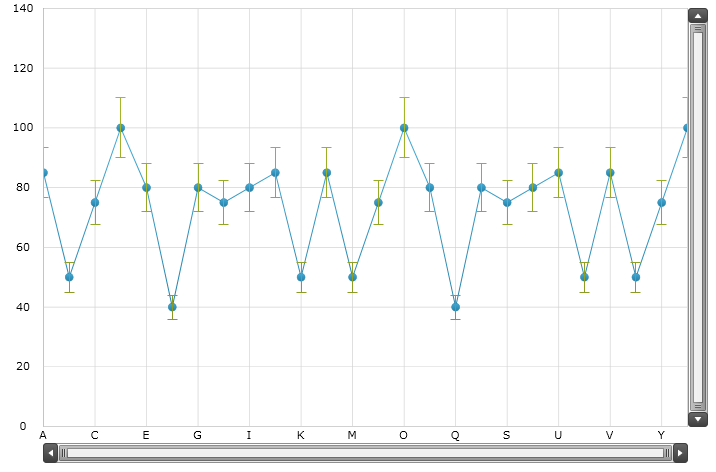
Figure 3 - Line Series with the Percentage Error Bars
The following code listing demonstrates how to display the Standard Error Bars on the LineSeries.
In XAML:
<ig:LineSeries.ErrorBarSettings>
    <ig:ScatterErrorBarSettings EnableErrorBars="Both" >
        <ig:CategoryErrorBarSettings.Calculator>
            <igCalc:StandardErrorCalculator ItemsSource="{StaticResource CategoryData}" ValueMemberPath="Value" />
        </ig:CategoryErrorBarSettings.Calculator>
    </ig:ScatterErrorBarSettings>
</ig:LineSeries.ErrorBarSettings>
In Visual Basic:
Imports Infragistics.Controls.Charts
Imports Infragistics.Math.Calculators
'...
Dim series As New LineSeries()
'...
Dim barsSettings As New CategoryErrorBarSettings()
barsSettings.EnableErrorBars = EnableErrorBars.Both
barsSettings.Calculator = New StandardErrorCalculator()
barsSettings.Calculator.ItemsSource = series.ItemsSource
barsSettings.Calculator.ValueMemberPath = "Value"
'...
series.ErrorBarSettings = barsSettings
In C#:
using Infragistics.Controls.Charts;
using Infragistics.Math.Calculators;
//...
LineSeries series = new LineSeries();
//...
CategoryErrorBarSettings barsSettings = new CategoryErrorBarSettings();
barsSettings.EnableErrorBars = EnableErrorBars.Both;
barsSettings.Calculator = new StandardErrorCalculator();
barsSettings.Calculator.ItemsSource = series.ItemsSource;
barsSettings.Calculator.ValueMemberPath = "Value";
//...
series.ErrorBarSettings = barsSettings;
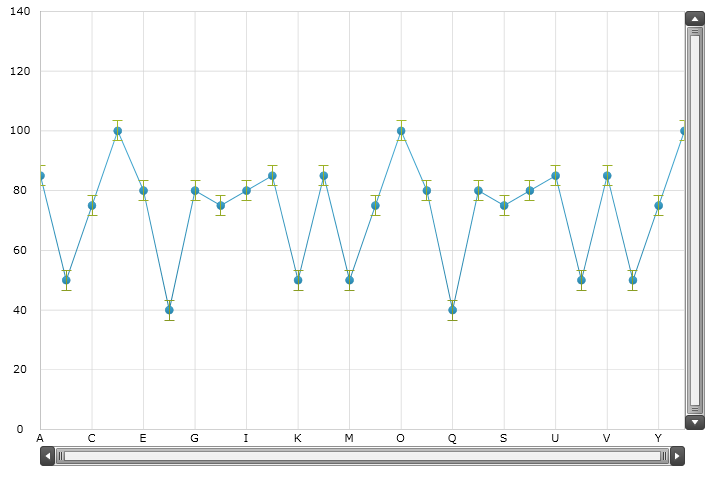
Figure 3 - Line Series with the Standard Error Bars
The following code listing demonstrates how to display the Standard Deviation Error Bars on the LineSeries.
In XAML:
<ig:LineSeries.ErrorBarSettings>
    <ig:ScatterErrorBarSettings EnableErrorBars="Both" >
        <ig:CategoryErrorBarSettings.Calculator>
            <igCalc:StandardDeviationCalculator ItemsSource="{StaticResource CategoryData}" ValueMemberPath="Value" />
        </ig:CategoryErrorBarSettings.Calculator>
    </ig:ScatterErrorBarSettings>
</ig:LineSeries.ErrorBarSettings>
In Visual Basic:
Imports Infragistics.Controls.Charts
Imports Infragistics.Math.Calculators
'...
Dim series As New LineSeries()
'...
Dim barsSettings As New CategoryErrorBarSettings()
barsSettings.EnableErrorBars = EnableErrorBars.Both
barsSettings.Calculator = New StandardDeviationCalculator()
barsSettings.Calculator.ItemsSource = series.ItemsSource
barsSettings.Calculator.ValueMemberPath = "Value"
'...
series.ErrorBarSettings = barsSettings
In C#:
using Infragistics.Controls.Charts;
using Infragistics.Math.Calculators;
//...
LineSeries series = new LineSeries();
//...
CategoryErrorBarSettings barsSettings = new CategoryErrorBarSettings();
barsSettings.EnableErrorBars = EnableErrorBars.Both;
barsSettings.Calculator = new StandardDeviationCalculator();
barsSettings.Calculator.ItemsSource = series.ItemsSource;
barsSettings.Calculator.ValueMemberPath = "Value";
//...
series.ErrorBarSettings = barsSettings;
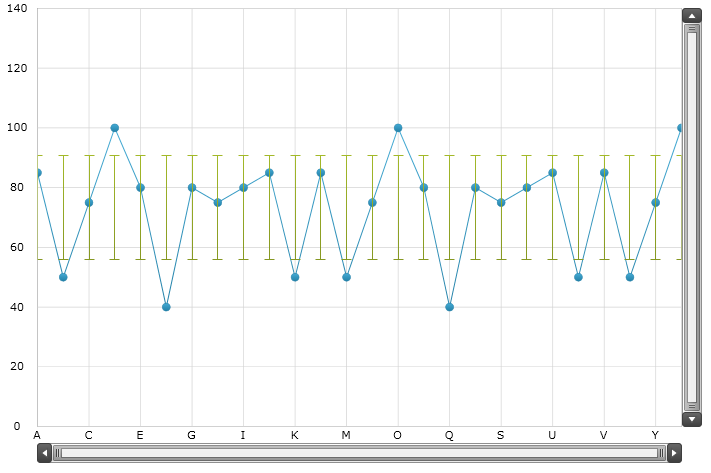
Figure 3 - Line Series with the Standard Deviation Error Bars
The following code listing demonstrates how to display Custom Data Error Bars on the LineSeries. Values for the Custom Data Error Bars are provided by a set of data bound to the ItemsSource property of the DataCalculator.
In Visual Basic:
Imports System.Collections.ObjectModel
'...
Public Class ErrorBarDataSample
    Inherits ErrorBarDataCollection
    Public Sub New()
        Me.New(0.1, 100)
    End Sub
    Public Sub New(variable As Double, items As Integer)
        Dim value As Double = 0
        For i As Integer = 0 To items - 2
            Dim dataPoint As New ErrorBarDataPoint()
            dataPoint.Value = value
            Me.Add(dataPoint)
            If i < (items / 2) Then
                value += variable
            Else
                value -= variable
            End If
        Next
    End Sub
End Class
Public Class ErrorBarDataCollection
    Inherits ObservableCollection(Of ErrorBarDataPoint)
End Class
Public Class ErrorBarDataPoint
    Public Property Value() As Double
        Get
            Return value
        End Get
        Set
            _value = Value
        End Set
    End Property
    Private value As Double
End Class
In C#:
using System.Collections.ObjectModel;
//...
public class ErrorBarDataSample : ErrorBarDataCollection
{
    public ErrorBarDataSample(): this(0.1, 100)
    { }
    public ErrorBarDataSample(double variable, int items)
    {
        double value = 0;
        for (int i = 0; i < items - 1; i++)
        {
            ErrorBarDataPoint dataPoint = new ErrorBarDataPoint();
            dataPoint.Value = value;
              this.Add(dataPoint);
              if (i < (items / 2)) value += variable; else value -= variable;
        }
    }
}
public class ErrorBarDataCollection : ObservableCollection<ErrorBarDataPoint>
{ }
public class ErrorBarDataPoint
{
    public double Value { get; set; }
}
In XAML:
<ig:LineSeries.ErrorBarSettings>
    <ig:ScatterErrorBarSettings EnableErrorBars="Both" >
        <ig:CategoryErrorBarSettings.Calculator>
            <igCalc:DataCalculator ItemsSource="{StaticResource ErrorBarData}" ValueMemberPath="Value" />
        </ig:CategoryErrorBarSettings.Calculator>
    </ig:ScatterErrorBarSettings>
</ig:LineSeries.ErrorBarSettings>
In Visual Basic:
Imports Infragistics.Controls.Charts
Imports Infragistics.Math.Calculators
'...
Dim series As New LineSeries()
'...
Dim errorBarsData As New ErrorBarDataSample()
Dim barsSettings As New CategoryErrorBarSettings()
barsSettings.EnableErrorBars = EnableErrorBars.Both
barsSettings.Calculator = New DataCalculator()
barsSettings.Calculator.ItemsSource = errorBarsData
barsSettings.Calculator.ValueMemberPath = "Value"
'...
series.ErrorBarSettings = barsSettings
In C#:
using Infragistics.Controls.Charts;
using Infragistics.Math.Calculators;
//...
LineSeries series = new LineSeries();
//...
ErrorBarDataSample errorBarsData = new ErrorBarDataSample();
CategoryErrorBarSettings barsSettings = new CategoryErrorBarSettings();
barsSettings.EnableErrorBars = EnableErrorBars.Both;
barsSettings.Calculator = new DataCalculator();
barsSettings.Calculator.ItemsSource = errorBarsData
barsSettings.Calculator.ValueMemberPath = "Value"
//...
series.ErrorBarSettings = barsSettings;
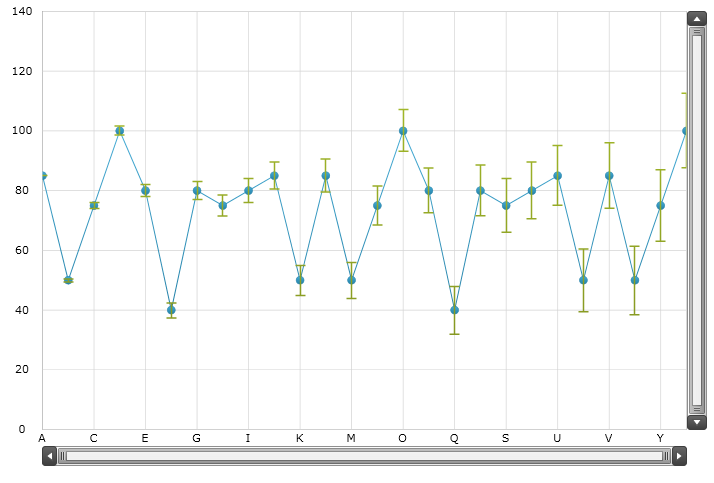
Figure 3 - Line Series with the Custom Data Error Bars
The following code listing demonstrates how to display the Fixed Value Error Bars on the ScatterSeries.
In XAML:
<ig:ScatterSeries.ErrorBarSettings>
    <ig:ScatterErrorBarSettings EnableErrorBarsHorizontal="Both"
                                EnableErrorBarsVertical="Both" >
        <ig:ScatterErrorBarSettings.HorizontalCalculator>
            <igCalc:FixedValueCalculator Value="2" />
        </ig:ScatterErrorBarSettings.HorizontalCalculator>
        <ig:ScatterErrorBarSettings.VerticalCalculator>
            <igCalc:FixedValueCalculator Value="20" />
        </ig:ScatterErrorBarSettings.VerticalCalculator>
    </ig:ScatterErrorBarSettings>
</ig:ScatterSeries.ErrorBarSettings>
In Visual Basic:
Imports Infragistics.Controls.Charts
Imports Infragistics.Math.Calculators
'...
Dim barsSettings As New ScatterErrorBarSettings()
barsSettings.EnableErrorBarsHorizontal = EnableErrorBars.Both
barsSettings.HorizontalCalculator = New FixedValueCalculator()
barsSettings.HorizontalCalculator.Value = 2.0
'...
barsSettings.EnableErrorBarsVertical = EnableErrorBars.Both
barsSettings.VerticalCalculator = New FixedValueCalculator()
barsSettings.VerticalCalculator.Value = 20.0
'...
Dim series As New ScatterSeries()
'...
series.ErrorBarSettings = barsSettings
In C#:
using Infragistics.Controls.Charts;
using Infragistics.Math.Calculators;
//...
ScatterErrorBarSettings barsSettings = new ScatterErrorBarSettings();
barsSettings.EnableErrorBarsHorizontal = EnableErrorBars.Both;
barsSettings.HorizontalCalculator = new FixedValueCalculator();
barsSettings.HorizontalCalculator.Value = 2.0;
//...
barsSettings.EnableErrorBarsVertical = EnableErrorBars.Both;
barsSettings.VerticalCalculator = new FixedValueCalculator();
barsSettings.VerticalCalculator.Value = 20.0;
//...
ScatterSeries series = new ScatterSeries();
//...
series.ErrorBarSettings = barsSettings;
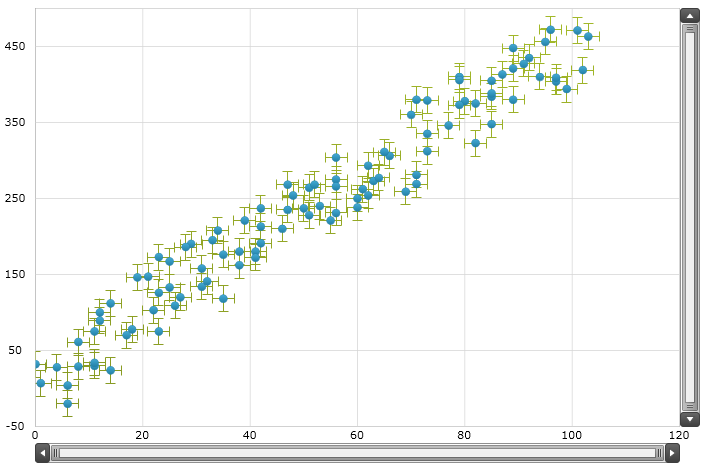
Figure 3 - Scatter Series with the Fixed Value Error Bars
The following code listing demonstrates how to display the Percentage Error Bars on the ScatterSeries.
In XAML:
<ig:ScatterSeries.ErrorBarSettings>
    <ig:ScatterErrorBarSettings EnableErrorBarsHorizontal="Both"
                                EnableErrorBarsVertical="Both" >
        <ig:ScatterErrorBarSettings.HorizontalCalculator>
            <igCalc:PercentageCalculator Value="5" />
        </ig:ScatterErrorBarSettings.HorizontalCalculator>
        <ig:ScatterErrorBarSettings.VerticalCalculator>
            <igCalc:PercentageCalculator Value="10" />
        </ig:ScatterErrorBarSettings.VerticalCalculator>
    </ig:ScatterErrorBarSettings>
</ig:ScatterSeries.ErrorBarSettings>
In Visual Basic:
Imports Infragistics.Controls.Charts
Imports Infragistics.Math.Calculators
'...
Dim barsSettings As New ScatterErrorBarSettings()
barsSettings.EnableErrorBarsHorizontal = EnableErrorBars.Both
barsSettings.HorizontalCalculatorReference = ErrorBarCalculatorReference.X
barsSettings.HorizontalCalculator = New PercentageCalculator()
barsSettings.HorizontalCalculator.Value = 5.0
'...
barsSettings.EnableErrorBarsVertical = EnableErrorBars.Both
barsSettings.VerticalCalculatorReference = ErrorBarCalculatorReference.Y
barsSettings.VerticalCalculator = New PercentageCalculator()
barsSettings.HorizontalCalculator.Value = 10.0
'...
Dim series As New ScatterSeries()
'...
series.ErrorBarSettings = barsSettings
In C#:
using Infragistics.Controls.Charts;
using Infragistics.Math.Calculators;
//...
ScatterErrorBarSettings barsSettings = new ScatterErrorBarSettings();
barsSettings.EnableErrorBarsHorizontal = EnableErrorBars.Both;
barsSettings.HorizontalCalculatorReference = ErrorBarCalculatorReference.X;
barsSettings.HorizontalCalculator = new PercentageCalculator();
barsSettings.HorizontalCalculator.Value = 5.0;
//...
barsSettings.EnableErrorBarsVertical = EnableErrorBars.Both;
barsSettings.VerticalCalculatorReference = ErrorBarCalculatorReference.Y;
barsSettings.VerticalCalculator = new PercentageCalculator();
barsSettings.HorizontalCalculator.Value = 10.0;
//...
ScatterSeries series = new ScatterSeries();
//...
series.ErrorBarSettings = barsSettings;
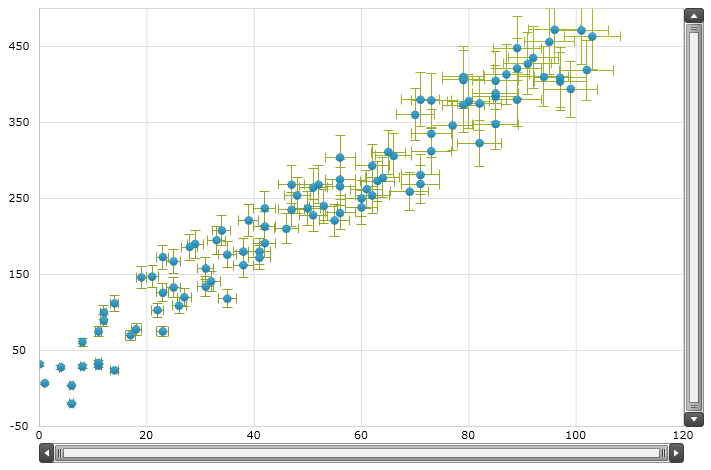
Figure 4 - Scatter Series with the Percentage Error Bars
The following code listing demonstrates how to display the Standard Error Bars on the ScatterSeries.
In XAML:
<ig:ScatterSeries.ErrorBarSettings>
    <ig:ScatterErrorBarSettings EnableErrorBarsHorizontal="Both" >
        <ig:ScatterErrorBarSettings.HorizontalCalculator>
            <igCalc:StandardErrorCalculator ItemsSource="{StaticResource ScatterData}" ValueMemberPath="X" />
        </ig:ScatterErrorBarSettings.HorizontalCalculator>
    </ig:ScatterErrorBarSettings>
</ig:ScatterSeries.ErrorBarSettings>
In Visual Basic:
Imports Infragistics.Controls.Charts
Imports Infragistics.Math.Calculators
'...
Dim series As New ScatterSeries()
'...
Dim barsSettings As New ScatterErrorBarSettings()
barsSettings.EnableErrorBarsHorizontal = EnableErrorBars.Both
barsSettings.HorizontalCalculator = New StandardErrorCalculator()
barsSettings.HorizontalCalculator.ItemsSource = series.ItemsSource
barsSettings.HorizontalCalculator.ValueMemberPath = "X"
'...
series.ErrorBarSettings = barsSettings
In C#:
using Infragistics.Controls.Charts;
using Infragistics.Math.Calculators;
//...
ScatterSeries series = new ScatterSeries();
//...
ScatterErrorBarSettings barsSettings = new ScatterErrorBarSettings();
barsSettings.EnableErrorBarsHorizontal = EnableErrorBars.Both;
barsSettings.HorizontalCalculator = new StandardErrorCalculator();
barsSettings.HorizontalCalculator.ItemsSource = series.ItemsSource;
barsSettings.HorizontalCalculator.ValueMemberPath = "X";
 //...
series.ErrorBarSettings = barsSettings;
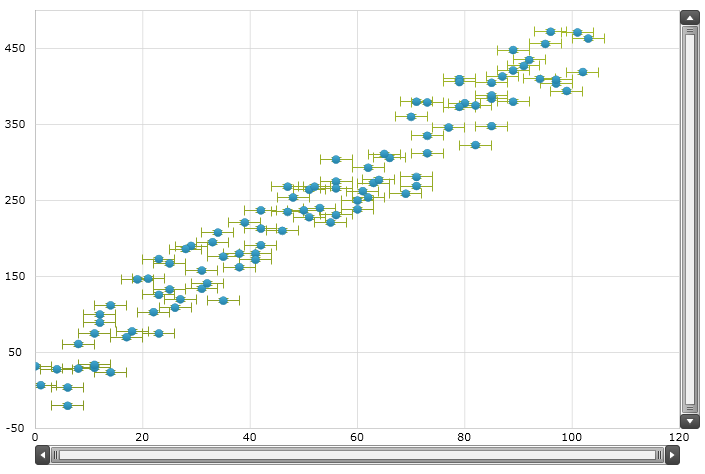
Figure 4 - Scatter Series with the Standard Error Bars
The following code listing demonstrates how to display the Standard Deviation Error Bars on the ScatterSeries.
In XAML:
<ig:ScatterSeries.ErrorBarSettings>
    <ig:ScatterErrorBarSettings EnableErrorBarsVertical="Both" >
        <ig:ScatterErrorBarSettings.VerticalCalculator>
            <igCalc:StandardDeviationCalculator ItemsSource="{StaticResource ScatterData}" ValueMemberPath="Y" />
        </ig:ScatterErrorBarSettings.VerticalCalculator>
    </ig:ScatterErrorBarSettings>
</ig:ScatterSeries.ErrorBarSettings>
In Visual Basic:
Imports Infragistics.Controls.Charts
Imports Infragistics.Math.Calculators
'...
Dim series As New ScatterSeries()
'...
Dim barsSettings As New ScatterErrorBarSettings()
barsSettings.EnableErrorBarsVertical = EnableErrorBars.Both
barsSettings.VerticalCalculator = New StandardDeviationCalculator()
barsSettings.VerticalCalculator.ItemsSource = series.ItemsSource
barsSettings.VerticalCalculator.ValueMemberPath = "Y"
'...
series.ErrorBarSettings = barsSettings
In C#:
using Infragistics.Controls.Charts;
using Infragistics.Math.Calculators;
//...
ScatterSeries series = new ScatterSeries();
//...
ScatterErrorBarSettings barsSettings = new ScatterErrorBarSettings();
barsSettings.EnableErrorBarsVertical = EnableErrorBars.Both;
barsSettings.VerticalCalculator = new StandardDeviationCalculator();
barsSettings.VerticalCalculator.ItemsSource = series.ItemsSource;
barsSettings.VerticalCalculator.ValueMemberPath = "Y";
//...
series.ErrorBarSettings = barsSettings;
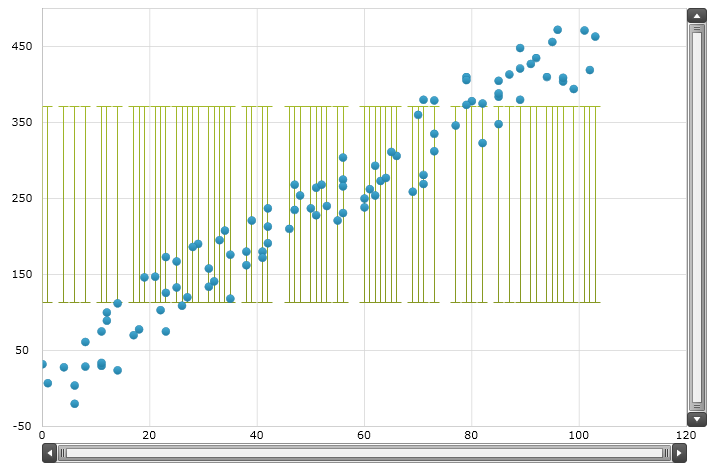
Figure 5 - Scatter Series with the Standard Deviation Error Bars
The following code listing demonstrates how to display Custom Data Error Bars on the ScatterSeries. Values for the Custom Data Error Bars are provided by a data set bound to the ItemsSource property of the DataCalculator.
In Visual Basic:
Imports System.Collections.ObjectModel
'...
Public Class ErrorBarDataSample
    Inherits ErrorBarDataCollection
    Public Sub New()
        Me.New(0.1, 100)
    End Sub
    Public Sub New(variable As Double, items As Integer)
        Dim value As Double = 0
        For i As Integer = 0 To items – 2
            Dim dataPoint As New ErrorBarDataPoint()
            dataPoint.Value = value
            Me.Add(dataPoint)
            If i < (items / 2) Then
                value += variable
            Else
                value -= variable
            End If
        Next
    End Sub
End Class
Public Class ErrorBarDataCollection
    Inherits ObservableCollection(Of ErrorBarDataPoint)
End Class
Public Class ErrorBarDataPoint
    Public Property Value() As Double
        Get
            Return value
        End Get
        Set
            _value = Value
        End Set
    End Property
    Private value As Double
End Class
In C#:
using System.Collections.ObjectModel;
//...
public class ErrorBarDataSample : ErrorBarDataCollection
{
    public ErrorBarDataSample(): this(0.1, 100)
    { }
    public ErrorBarDataSample(double variable, int items)
    {
        double value = 0;
        for (int i = 0; i < items - 1; i++)
        {
            ErrorBarDataPoint dataPoint = new ErrorBarDataPoint();
            dataPoint.Value = value;
              this.Add(dataPoint);
            if (i < (items / 2)) value += variable; else value -= variable;
        }
    }
}
public class ErrorBarDataCollection : ObservableCollection<ErrorBarDataPoint>
{ }
public class ErrorBarDataPoint
{
    public double Value { get; set; }
}
In XAML:
<ig:ScatterSeries.ErrorBarSettings>
    <ig:ScatterErrorBarSettings EnableErrorBarsVertical="Both" >
        <ig:ScatterErrorBarSettings.VerticalCalculator>
            <igCalc:DataCalculator ItemsSource="{StaticResource ErrorBarData}" ValueMemberPath="Value" />
        </ig:ScatterErrorBarSettings.VerticalCalculator>
    </ig:ScatterErrorBarSettings>
</ig:ScatterSeries.ErrorBarSettings>
In Visual Basic:
Imports Infragistics.Controls.Charts
Imports Infragistics.Math.Calculators
'...
Dim series As New ScatterSeries()
'...
Dim errorBarsData As New ErrorBarDataSample(1.5, 100)
Dim barsSettings As New ScatterErrorBarSettings()
barsSettings.EnableErrorBarsVertical = EnableErrorBars.Both
barsSettings.VerticalCalculator = New DataCalculator()
barsSettings.VerticalCalculator.ItemsSource = errorBarsData
barsSettings.VerticalCalculator.ValueMemberPath = "Value"
'...
series.ErrorBarSettings = barsSettings
In C#:
using Infragistics.Controls.Charts;
using Infragistics.Math.Calculators;
//...
ScatterSeries series = new ScatterSeries();
//...
ErrorBarDataSample errorBarsData = new ErrorBarDataSample(1.5, 100);
ScatterErrorBarSettings barsSettings = new ScatterErrorBarSettings();
barsSettings.EnableErrorBarsVertical = EnableErrorBars.Both;
barsSettings.VerticalCalculator = new DataCalculator();
barsSettings.VerticalCalculator.ItemsSource = errorBarsData;
barsSettings.VerticalCalculator.ValueMemberPath = "Value";
//...
series.ErrorBarSettings = barsSettings;
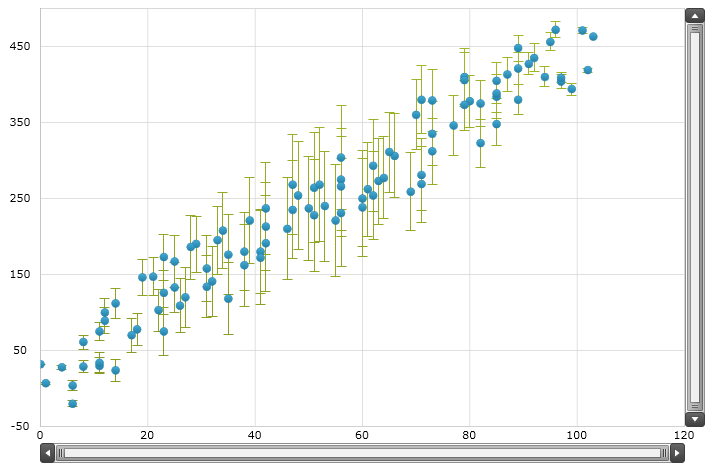
Figure 6 - Scatter Series with Custom Data Error Bars
