
This topic provides information on enabling the series highlighting feature along with a listing of the supported series. This topic also explains how to configure the series highlighting using the available events.
The following topic is a prerequisite to understanding this topic:
This topic contains the following sections:
This feature allows you to highlight an entire series or individual items within the series. For example, highlights the entire line in a series such as the LineSeries as it is all one shape; however, highlights can be applied to each individual column in a series such as ColumnSeries. Individual markers can be highlighted in all supported series.
Currently the feature only supports highlighting via the mouse.
The series highlighting feature is supported for the following series types:
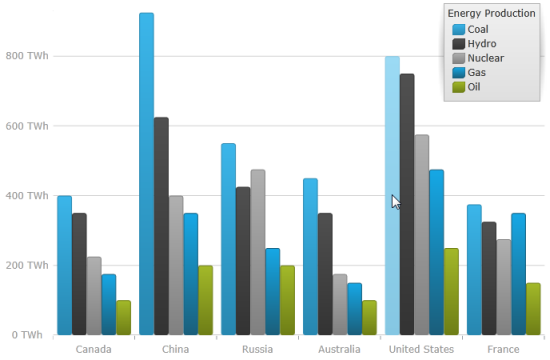
The following screenshot is a preview of the xam DataChart control with a ColumnSeries and the series highlighting feature enabled.
The following table summarizes the properties used for series highlighting. These properties are set on the supported series.
The screenshot, following the table, demonstrates how a chart with the IsHighlightingEnabled and HighlightingTransitionDuration properties of the ColumnSeries looks as a result of the following settings:
Following is the code that implements this example:
In XAML:
<ig:XamDataChart x:Name="xamColumnChart"
                 HighlightingTransitionDuration="00:00:10"
 <ig:XamDataChart.Series>
 <ig:ColumnSeries ItemsSource="{Binding EnergySampleData}"
                       ValueMemberPath="Coal"
                       Source="{StaticResource DataViewModel}"
                       XAxis="{Binding ElementName=ColumnXAxis}"
                       YAxis="{Binding ElementName=ColumnYAxis}"
                       IsHighlightingEnabled="True">
 </ig:ColumnSeries>
 </ig:XamDataChart.Series>
</ig:XamDataChart>There are two events that are specifically related to the series highlighting feature.
AssigningCategoryMarkerStyle (not supported for Financial Series or Financial Indicators)
The series highlighting feature is supported for the following series types:
These events can be configured to achieve the following:
Modify the way that the highlighting is represented
Modify the appearance properties assigned to the entire series such as a LineSeries, or each individual item in the series for the series having individual items such as ColumnSeries.
When using the above events to configure the highlighting on the series, only the properties that are available on that particular series can be used. For example, overriding the Fill or RadiusX property of a LineSeries does not have any affect since those properties do not affect the LineSeries.
The following table summarizes the properties of the AssigningCategoryStyleEventArgsBase.
The AssigningCategoryMarkerStyleEventArgs inherit all the same properties as the AssigningCategoryStyleEventArgsBase as listed in the table above.
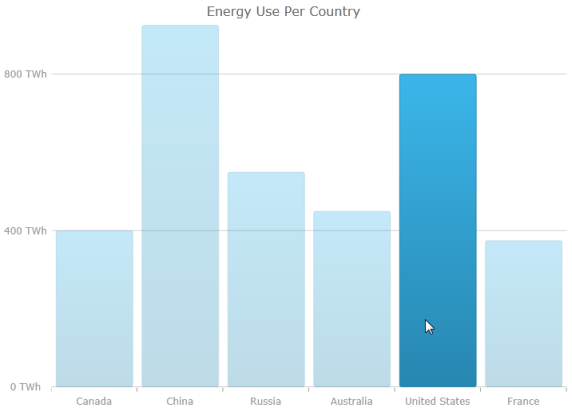
The following screenshot displays an example of using the AssigningCategoryStyle event to change the highlighting feature to fade non highlighting columns instead of changing the highlighting column.
Following is the code implemented for this example:
In C#:
private void CategorySeries_OnAssigningCategoryStyle(object sender, AssigningCategoryStyleEventArgs args)
{
 double minOpacity = .3, opacity = 1.0;
   if (args.SumAllSeriesHighlightingProgress > 0.0)
   {
      var progress = 0.0;
      if (args.HighlightingInfo != null)
      {
         progress = args.HighlightingInfo.Progress;
      }
      progress = progress - args.SumAllSeriesHighlightingProgress;
      opacity = minOpacity + (1.0 + progress) * (1.0 - minOpacity);
      args.Opacity = opacity;
      args.HighlightingHandled = true;
      for (var i = 0; i < this.DataChart.Series.Count; i++)
      {
         var curr = this.DataChart.Series[i];
         var series = sender as Infragistics.Controls.Charts.Series;
         if (series != null && series.Name != curr.Name)
         {
            curr.NotifyVisualPropertiesChanged();
         }
      }
   }
}
In Visual Basic:
Private Sub CategorySeries_OnAssigningCategoryStyle(ByVal sender As Object, ByVal args As AssigningCategoryStyleEventArgs)
Dim minOpacity As Double 3
Dim opacity As Double 1
If (args.SumAllSeriesHighlightingProgress > 0) Then
 Dim progress As var = 0
 If (Not (args.HighlightingInfo) Is Nothing) Then
 progress = args.HighlightingInfo.Progress
 End If
 progress = (progress - args.SumAllSeriesHighlightingProgress)
 opacity = (minOpacity + ((1 + progress) * (1 - minOpacity)))
 args.Opacity = opacity
 args.HighlightingHandled = true
 Dim i As var = 0
 Do While (i < Me.DataChart.Series.Count)
 Dim curr As var = Me.DataChart.Series(i)
 Dim series As var = CType(sender,Infragistics.Controls.Charts.Series)
 If ((Not (series) Is Nothing)
 AndAlso (series.Name <> curr.Name)) Then
 curr.NotifyVisualPropertiesChanged
 End If
 i = (i + 1)
 Loop
 End If
End SubThe following topics provide additional information related to this topic: