<ig:XamDataChart.Axes>
    <ig:NumericXAxis x:Name="xAxis" Name="Linear"  />
    <ig:NumericYAxis x:Name="yAxis" Name="Logarithmic" ScaleMode="Logarithmic" LogarithmBase="2" />
</ig:XamDataChart.Axes>
This topic introduces axis scales feature of the XamDataChart™ control and explains, with code examples, how to use supported axis scales.
The topic is organized as follows:
In the XamDataChart control, numeric axes allow scaling data values using built-in scalers. This is accomplished by setting enum value to the ScaleMode property on a numeric axis. Setting this property effectively sets the axis scaler to a linear or logarithmic mode.
The behavior is the same as setting the NumericAxisBase. Scaler property, but most often you will find the enumerable property more convenient to use. Refer to the Creating Custom Axis Scalers topic for information on how to apply custom axis scalers to the Scaler property of numeric axes.
The following table lists properties affecting scale of a numeric axis.
The following code snippet shows how to use built-in axis scalers to scale data values plotted in the XamDataChart control.
In XAML:
<ig:XamDataChart.Axes>
<ig:NumericXAxis x:Name="xAxis" Name="Linear" />
<ig:NumericYAxis x:Name="yAxis" Name="Logarithmic" ScaleMode="Logarithmic" LogarithmBase="2" />
</ig:XamDataChart.Axes>In C#:
var xAxis = new NumericXAxis();
xAxis.ScaleMode = NumericScaleMode.Linear;
var yAxis = new NumericYAxis();
yAxis.ScaleMode = NumericScaleMode.Logarithmic;
yAxis.LogarithmBase = 2;
In Visual Basic:
Dim xAxis As New NumericXAxis()
xAxis.ScaleMode = NumericScaleMode.Linear
Dim xAxis As New NumericYAxis()
yAxis.ScaleMode = NumericScaleMode.Logarithmic
yAxis.LogarithmBase = 2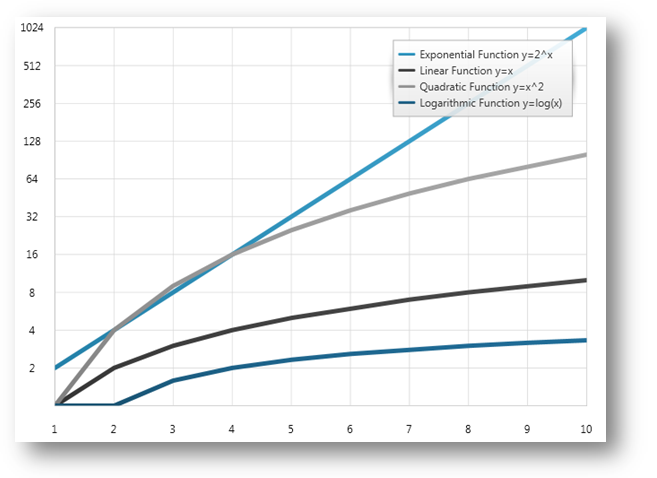
Figure 1 – Preview of the XamDataChart with logarithmic scale applied to y-axis.