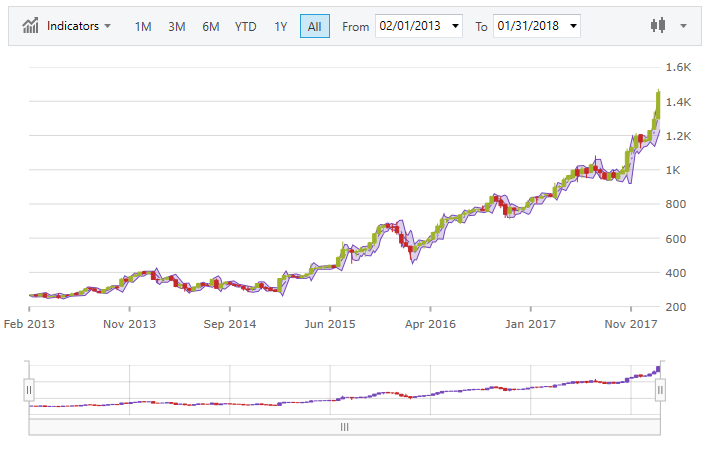

The below image demonstrates using the Financial Overlays with the XamFinancialChart. There are two types of overlays the BollingerBands and PriceChannel.
The following demonstrates how to set the OverlayTypes through code:
In XAML:
<ig:XamFinancialChart ItemsSource="{Binding}"
    OverlayTypes="BollingerBands"
    OverlayBrushes="Red"
    OverlayOutlines="Green"
    OverlayThickness="2" />
In Visual Basic:
Dim chart as New XamFinancialChart()
chart.OverlayTypes = New FinancialOverlayTypeCollection()
chart.OverlayTypes.Add(Infragistics.Controls.Charts.FinancialOverlayType.BollingerBands)

chart.OverlayBrushes = New Infragistics.BrushCollection()
Dim brush As SolidColorBrush = New SolidColorBrush()
brush.Color = Colors.Red;
chart.OverlayBrushes.Add(brush)

chart.OverlayOutLines = new Infragistics.BrushCollection()
Dim brush2 As SolidColorBrush = New SolidColorBrush()
brush2.Color = Colors.Green
chart.OverlayOutLines.Add(brush2)

chart.OverlayThickness = 2
In C#:
var chart = new XamFinancialChart();
chart.OverlayTypes = new FinancialOverlayTypeCollection();
chart.OverlayTypes.Add(Infragistics.Controls.Charts.FinancialOverlayType.BollingerBands);

chart.OverlayBrushes = new Infragistics.BrushCollection();
SolidColorBrush brush = new SolidColorBrush();
brush.Color = Colors.Red;
chart.OverlayBrushes.Add(brush);

chart.OverlayOutLines = new Infragistics.BrushCollection();
SolidColorBrush brush2 = new SolidColorBrush();
brush2.Color = Colors.Green;
chart.OverlayOutLines.Add(brush2);

chart.OverlayThickness = 2;