
This topic demonstrates, with code examples, how to perform calculations with xamPivotGrid™ members.
The following table lists the topics required as a prerequisite to understanding this topic.
This topic contains the following sections:
The Calculated Measures feature offers a way to create a member that can be added to rows or columns, which represent the result of the defined measures. The data that the calculated member represents is cross-joined with the data of other items in the rows or columns to display the calculated result.
The calculated measures give you an option to create your own calculations used for the values that appear in the cells. The calculated measures are added to Measures’ collection.
The xamPivotGrid supports other data sources, but the Calculated Measures feature supports only XMLA data source.
The procedure involves creating measures for calculation, and members to display the result from the calculated measures as a separate column.
The implementation of calculated measures is a two-step process. The first step is to create the measures with the calculated expression, and the second step is to create the members associated with the calculated measures and expression.
By default, all calculated measures are attached to the Measures’ dimension, which can be changed by using the 4th and 5th parameters in the constructor of CalculatedMeasureViewModel.
An XMLA data source bound to the xamPivotGrid.
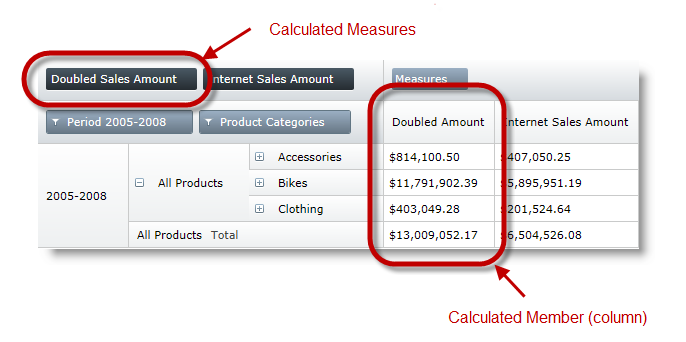
The example that follows uses the measures of the InternetSalesAmount column to double its values and display the result in a separate column for year period 2005 – 2008 which was used as an expression for calculation. The member that represents the calculated measures is named Doubled Sales Amount.
Following is a preview of the final result.
A xamPivotGrid bound to an XMLA data source.
Following is a conceptual overview of the process:
1. Creating the Calculated Measures
2. Creating the Calculated Members
Create the Calculated Measures.
Create a calculated measure that defines the expression of calculation in the Measures hierarchy. In the example here, the Internet Sales Amount in the measures hierarchy is part of the expression, multiplying the Internet Sales Amount by 2.
In C#:
ICalculatedItemViewModel calcMeasureViewModel =
    new CalculatedMeasureViewModel(
        "Doubled Amount",
        "Doubled Sales Amount",
        "[Measures].[Internet Sales Amount] * 2");
this.pivotGrid.DataSource.Measures.Add(calcMeasureViewModel);
In Visual Basic:
Dim calcMeasureViewModel As ICalculatedItemViewModel = New CalculatedMeasureViewModel("Doubled Amount", "Doubled Sales Amount", "[Measures].[Internet Sales Amount] * 2")
Me.pivotGrid.DataSource.Measures.Add(calcMeasureViewModel)
Create the Calculated Members.
Create a calculated member with the hierarchy to which it is attached.
In C#:
IHierarchy dateCalendar = this.pivotGrid.DataSource.Cube.Dimensions["[Date]"].Hierarchies["Calendar"];
ICalculatedItemViewModel dateCalendarCalcItem = new CalculatedMemberViewModel(
    dateCalendar,
    "2005-2008",
    "Period 2005-2008",
    "[Date].[Calendar].[Calendar Year].[CY 2008] - [Date].[Calendar].[Calendar Year].[CY 2005]",
    false);
this.pivotGrid.DataSource.Rows.Add(dateCalendarCalcItem);
In Visual Basic:
Dim dateCalendar As IHierarchy = Me.pivotGrid.DataSource.Cube.Dimensions("[Date]").Hierarchies("Calendar")
Dim dateCalendarCalcItem As ICalculatedItemViewModel = New CalculatedMemberViewModel(dateCalendar, "2005-2008", "Period 2005-2008", "[Date].[Calendar].[Calendar Year].[CY 2008] - [Date].[Calendar].[Calendar Year].[CY 2005]", True)
Me.pivotGrid.DataSource.Rows.Add(dateCalendarCalcItem)In XAML:
<igOlap:XmlaDataSource
     x:Key="DataSource"
     ServerUri="http://sampledata.infragistics.com/olap/msmdpump.dll"
     Database="Adventure Works DW Standard Edition"
     Cube="Adventure Works"
     Columns="[Geography].[City]"
     Rows="[Product].[Product Categories]"
Measures="Internet Sales Amount" />The following topics provide additional information related to this topic.