

The MapColorSwatchPane is a special kind of legend that displays information about the map colors in relation to the values corresponding to each MapElement object. A ValueScale object must be defined for the Color Swatch Pane to display the relation. This is useful in Choropleth mode which maps values to a range of colors; displaying a Color Swatch Pane shows the values and the corresponding colors. The Color Swatch Pane has 3 display modes: Sample, Swatch, and Range.
Sample
Sample mode displays swatches of colors with a sample value above each swatch showing what a map element with the displayed value looks like.
Swatch
Swatch mode displays an entire range of color and displays values of Map Elements on this range.
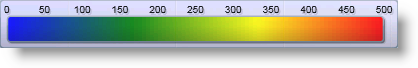
The sample swatch illustrates what the color for a certain value will be, as well as colors for values in between the labeled values.
Range
The Range Color Swatch Pane looks much like the Sample Color Swatch Pane except the values are shown as edge values for a color. In this way, the color for a certain range of values can be determined.
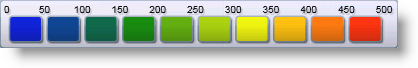
The Sample swatch shows that values 0 to 50 will be blue; values 51 to 100 will be lighter blue, and so on.
The xamMap control’s MapColorSwatchPane object displays the relationship between values and colors of map elements. Set the LayerName property to display that layer’s color information.
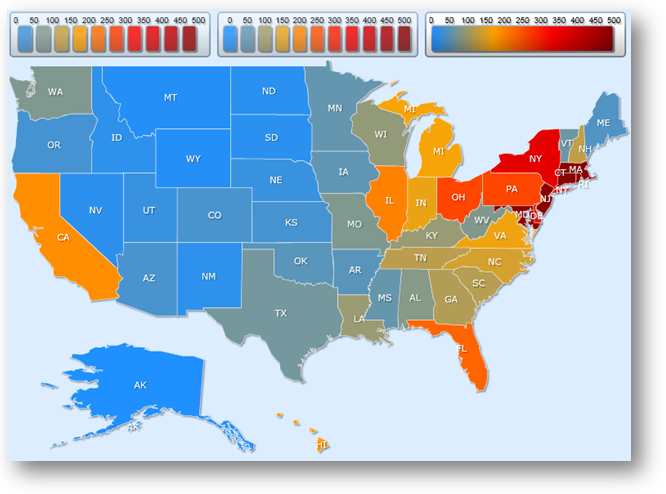
The following code shows you how to display the 3 Color Swatch Panes for the xamMap control in Choropleth fill mode.
In XAML:
xmlns:ig="http://schemas.infragistics.com/xaml"
xmlns:igMap="http://schemas.infragistics.com/xaml"
<!-- ... -->
<igMap:XamMap x:Name="xamMap" >
    <!-- Map Layer with Shapefile -->
    <igMap:XamMap.Layers>
        <igMap:MapLayer x:Name="mapLayer" LayerName="statesLayer" FillMode="Choropleth" >
            <!-- Reader for shapefile -->
            <igMap:MapLayer.Reader>
                <igMap:ShapeFileReader Uri="/../../Shapefiles/usa/usa_st"
                         DataMapping="Caption=STATE_ABBR; Value=POP90_SQMI"
            </igMap:MapLayer.Reader>
            <!-- Brush Collection for coloring shapefile -->
            <igMap:MapLayer.Brushes>
                <ig:BrushCollection>
                    <SolidColorBrush Color="DodgerBlue"
                    <SolidColorBrush Color="Orange"
                    <SolidColorBrush Color="Red"
                    <SolidColorBrush Color="DarkRed"
                </ig:BrushCollection>
            </igMap:MapLayer.Brushes>
            <!-- Value Scale -->
            <igMap:MapLayer.ValueScale>
                <igMap:LinearScale IsAutoRange="
                                           MinimumValue="0"
                                           MaximumValue="500"
            </igMap:MapLayer.ValueScale>
        </igMap:MapLayer>
    </igMap:XamMap.Layers>
    <!--TODO: Add Color Swatch Panes -->
    <igMap:MapColorSwatchPane igCtrl:XamDock.Edge="InsideTop" Width="250" Height="60"
                                     LayerName="statesLayer" DisplayMode="Range" Margin="2"
    <igMap:MapColorSwatchPane igCtrl:XamDock.Edge="InsideTop" Width="250" Height="60"
                                     LayerName="statesLayer" DisplayMode="Sample" Margin="2"
    <igMap:MapColorSwatchPane igCtrl:XamDock.Edge="InsideTop" Width="250" Height="60"
                                     LayerName="statesLayer" DisplayMode="Swatch" Margin="2"
</igMap:XamMap>
In Visual Basic:
' Color Swatch Pane in Range Display Mode
Dim pane1 As New MapColorSwatchPane()
pane1.Width = 250
pane1.Height = 60
pane1.LayerName = "statesLayer"
pane1.DisplayMode = ColorSwatchPaneDisplayMode.Range
pane1.SetValue(XamDock.EdgeProperty, DockEdge.InsideTop)
' Color Swatch Pane in Sample Display Mode
Dim pane2 As New MapColorSwatchPane()
pane2.Width = 250
pane2.Height = 60
pane2.LayerName = "statesLayer"
pane2.DisplayMode = ColorSwatchPaneDisplayMode.Sample
pane2.SetValue(XamDock.EdgeProperty, DockEdge.InsideTop)
' Color Swatch Pane in Swatch Display Mode
Dim pane3 As New MapColorSwatchPane()
pane3.Width = 250
pane3.Height = 60
pane3.LayerName = "statesLayer"
pane3.DisplayMode = ColorSwatchPaneDisplayMode.Swatch
pane3.SetValue(XamDock.EdgeProperty, DockEdge.InsideTop)
xamMap.LogicalChildren.Add(pane1)
xamMap.LogicalChildren.Add(pane2)
xamMap.LogicalChildren.Add(pane3)
In C#:
// Color Swatch Pane in Range Display Mode
MapColorSwatchPane pane1 = new MapColorSwatchPane();
pane1.Width = 250;
pane1.Height = 60;
pane1.LayerName = "statesLayer";
pane1.DisplayMode = ColorSwatchPaneDisplayMode.Range;
pane1.SetValue(XamDock.EdgeProperty, DockEdge.InsideTop);
// Color Swatch Pane in Sample Display Mode
MapColorSwatchPane pane2 = new MapColorSwatchPane();
pane2.Width = 250;
pane2.Height = 60;
pane2.LayerName = "statesLayer";
pane2.DisplayMode = ColorSwatchPaneDisplayMode.Sample;
pane2.SetValue(XamDock.EdgeProperty, DockEdge.InsideTop);
// Color Swatch Pane in Swatch Display Mode
MapColorSwatchPane pane3 = new MapColorSwatchPane();
pane3.Width = 250;
pane3.Height = 60;
pane3.LayerName = "statesLayer";
pane3.DisplayMode = ColorSwatchPaneDisplayMode.Swatch;
pane3.SetValue(XamDock.EdgeProperty, DockEdge.InsideTop);
xamMap.LogicalChildren.Add(pane1);
xamMap.LogicalChildren.Add(pane2);
xamMap.LogicalChildren.Add(pane3);