
This topic explains using a code example how to add the XamDoughnutChart™ control to a Xamarin.Forms application.
The following topic is a prerequisite to understanding this topic:
This topic contains the following sections:
The following procedure demonstrates how to add a XamDoughnutChart to a Xamarin.Forms application.
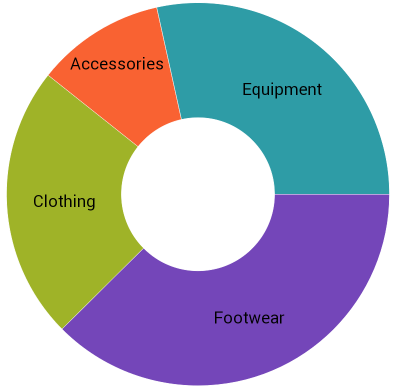
The following screenshot is a preview of the result.
Add assembly references by following instructions in the Add References Through NuGet Packages topic.
Also, you need a blank ContentPage with the Infragistics xml namespace declared as follows:
In XAML:
xmlns:ig="clr-namespace:Infragistics.XamarinForms.Controls.Charts;assembly=Infragistics.XF.Charts"Following is a conceptual overview of the process:
1. Adding sample data
2. Adding the XamDoughnutChart control
3. Adding the series
The following steps demonstrate how to add the XamDoughnutChart control to an application.
1. Define the sample data model class
In the code-behind of your page, add the following class declaration:
In C#:
public class Category
{
    public string Label { get; set; }
    public double AveragePrice { get; set; }
}
Create a list of instances of this class to serve as the ItemsSource for the rendered RingSeries.
2. Create a sample data list and set it as the ContentPage’s BindingContext.
In the constructor of the page add the following code:
In C#:
this.DataContext = new List<Category>()
{
    new Category () {Label="Footwear", AveragePrice=52.34},
    new Category () {Label="Clothing", AveragePrice=32.2},
    new Category () {Label="Accessories", AveragePrice=15.12},
    new Category () {Label="Equipment", AveragePrice=39.65}
};Add a XamDoughnutChart declaration :
In XAML:
<ig:XamDoughnutChart x:Name="doughnutChart">
</ig:XamDoughnutChart>1. Add the series.
In order to display data in a XamDoughnutChart , you need to add one or more series to its Series collection. This procedure uses one RingSeries.
2. Set the required properties to the series.
In order to configure the series correctly, you need to set the ItemsSource , ValueMemberPath and optionally the LabelMemberPath and LabelsPosition properties in accordance with the following steps.
Set the ItemsSource
The ItemsSource is an IEnumerable property that is where the data for the series comes from. In this example bind this property directly to the BindingContext.
Set the ValueMemberPath
You must set the ValueMemberPath to the name of a property used to calculate the size of its respective slice. In the case of this example set the property to “AveragePrice”.
Set the LabelMemberPath
You must set the LabelMemberPath to the name of a property in your data objects used to get the labels for each slice of the chart. In the case of this example set the property to “Label”.
Set the LabelsPosition (optional)
The LabelsPosition specifies labels positions relative to their slice. In the case of this example set it to BestFit.
In XAML:
<ig:XamDoughnutChart x:Name="doughnutChart">
    <ig:XamDoughnutChart.Series>
        <ig:RingSeries ItemsSource="{Binding}" LabelMemberPath="Label" ValueMemberPath="AveragePrice" LabelsPosition="BestFit"/>
    </ig:XamDoughnutChart.Series>
</ig:XamDoughnutChart>The following topic provides additional information related to this topic.