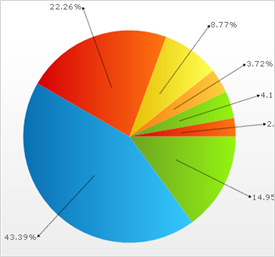
A 2D pie chart shows the size of items that make up a data series proportional to the total of the items in the series. A pie chart always shows a single data series, and is useful for determining which item or items in the series is (are) most significant.