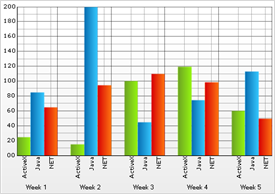
Grid lines are lines that are printed perpendicular to an axis at Major and Minor intervals. Their appearances are controlled by the UltraChart.Axis.n.MajorGridlines and UltraChart.Axis.n.MinorGridlines properties, where n is the letter of the axis in context (X, X2, Y, Y2, Z, or Z2).
For a numeric or date/time axis, a major interval directly corresponds to the TickmarkInterval property, and a minor interval is one half of the TickmarkInterval. For a SetLabelAxis object, a major interval is one series, and a minor interval is one item.
The following color-coded illustration depicts the location of grid lines for x- and y-axes:
