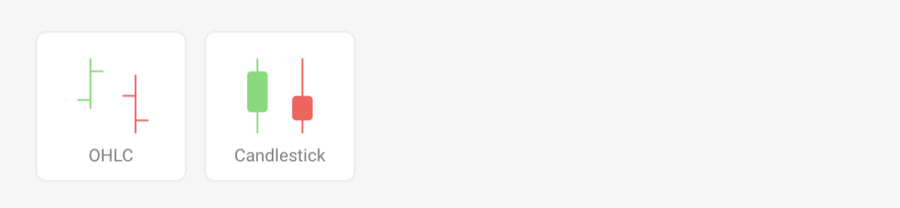
Financial charts are used to describe stock price movements during a full day (open and close values, and the highest and lowest values).
The color for each of the candle or OHLC sections is meant to represent whether the closing price is below or above its starting value.
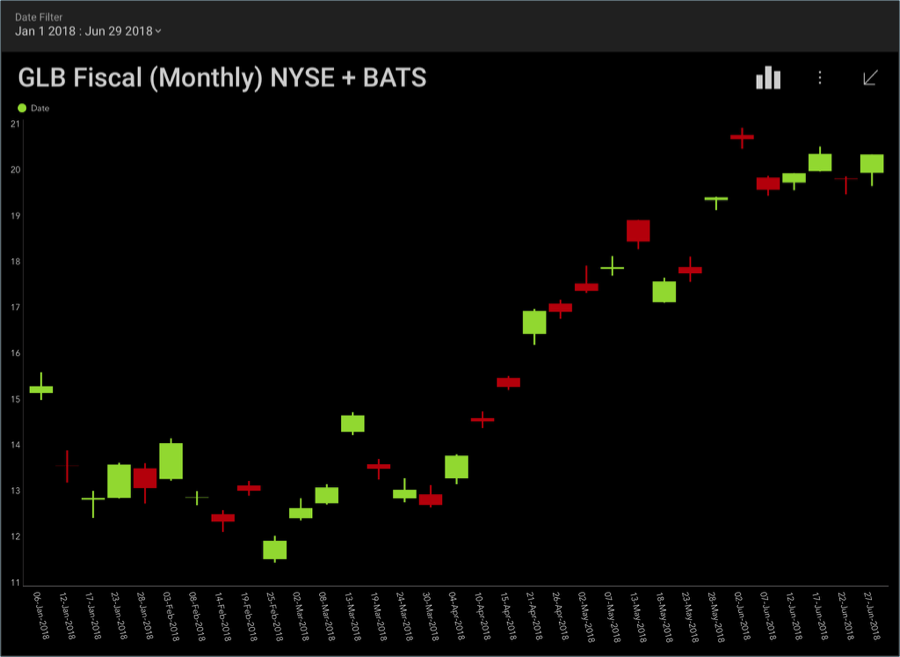
In the screenshot above, for example, the closing value was higher than the opening one for January 23rd. However, the closing value was lower for January 28th, as indicated by the red coloring of the candle.