The raw data that you drag and drop into the data editor placeholders will not be formatted by default; you will need to modify each field you have dragged individually.
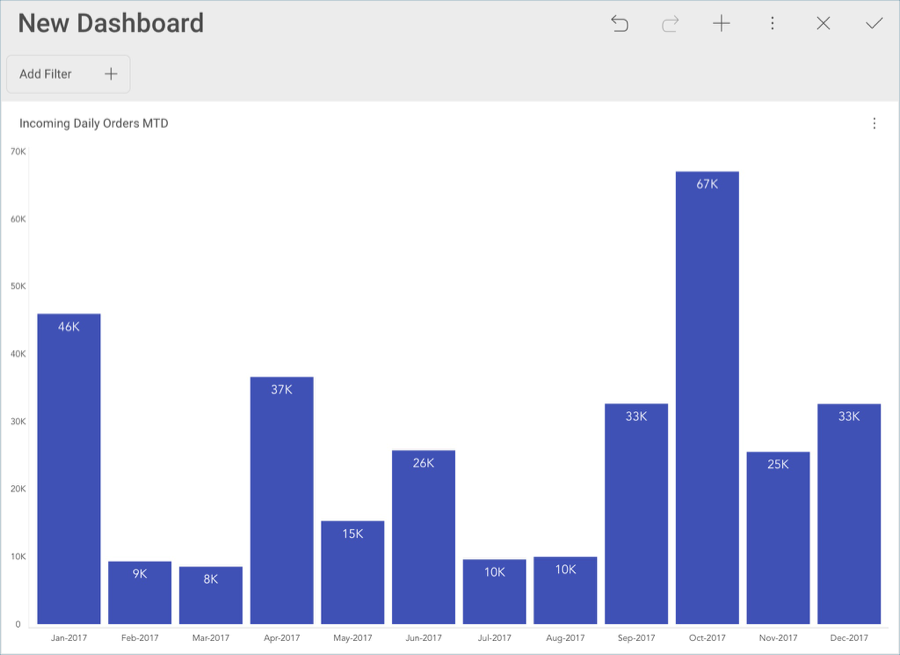
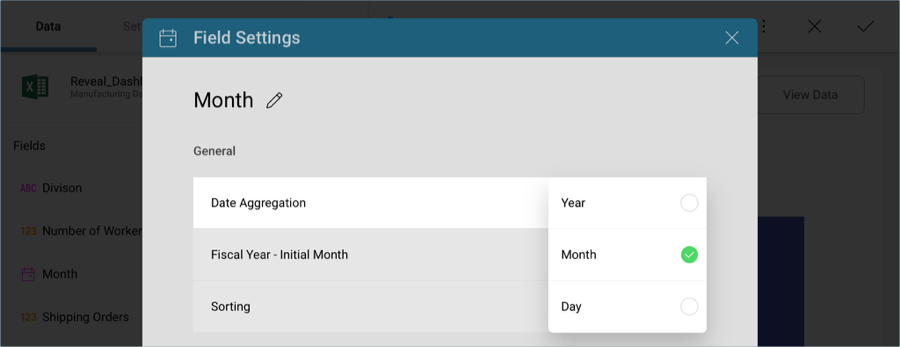
In order for your widget to match the sample dashboard’s you will need to select Month in the data editor placeholder, and change the Date Aggregation to Month in the Field Settings menu.
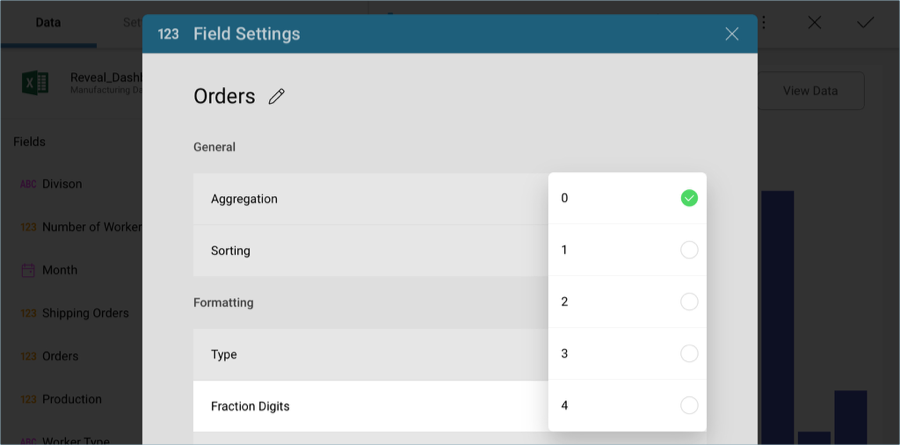
In order to show numbers with no fractions in the Y axis, you will need to modify the formatting for the Orders field dropped into the Values placeholder of the data editor. Select it, and change Fraction Digits to 0 under Formatting in the Field Settings menu.
Once you have finished editing the visualization, select the tick button in the top right-hand corner to return to the dashboard editor.