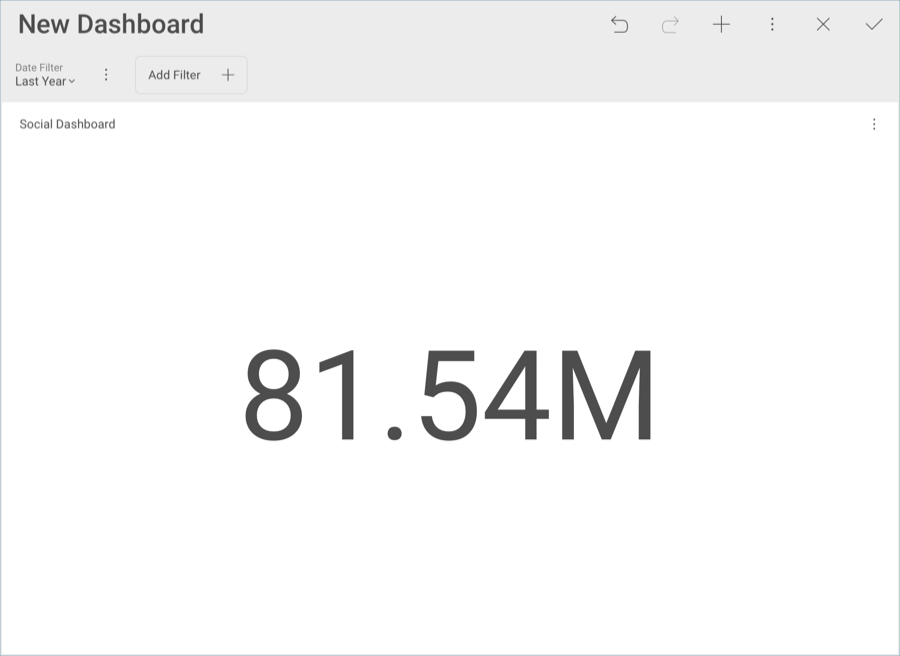
The dashboard displayed in the first page of this tutorial is connected to a date range dashboard filter. These kinds of filters enable a time-based scenario analysis. When connected to all visualizations, they allow for users to dynamically filter their whole dashboard.
In order create the filter, you will need to:
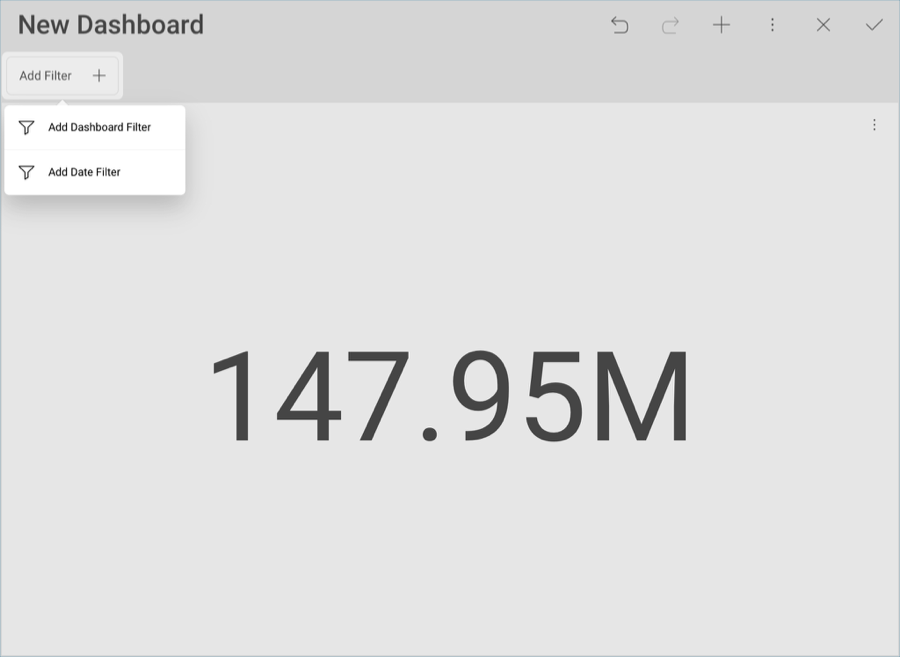
Select the Add Filter button under your dashbaord’s name, and then Add Date Filter
Under Date Filter, select Last Year.
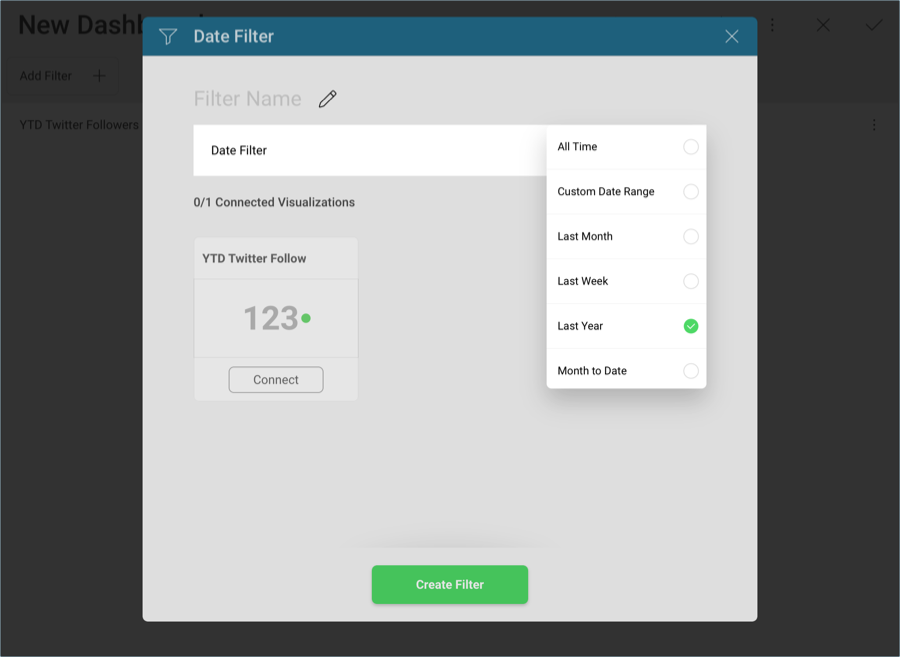
Once the date filter has been created, you will need to connect it to your existing visualization. In order to do so:
Select the Connect button in the YTD Twitter Followers visualization. Reveal will attempt to connect the dashboard filter to a field in your visualization.

If you select Date Filter, you will be able to edit the connection if necessary.
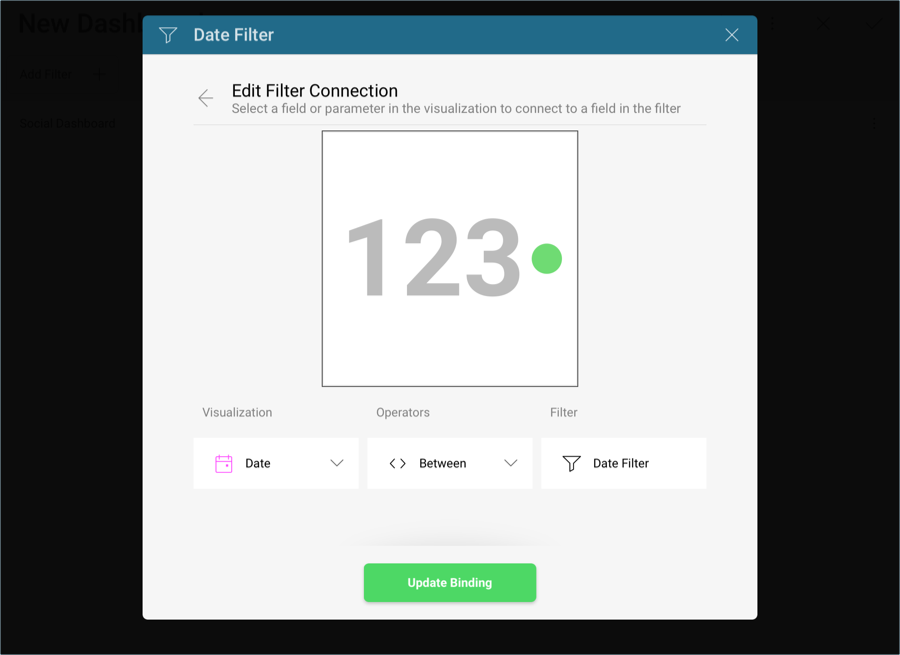
Select Update Binding.
Your visualization will the look like the following one: