Version

Getting Insights with Data Visualizations

In Slingshot you can get access to data visualizations. Visualizations are individual pieces of information, one or more visualizations presented together compose a dashboard.

Common visualization types are:

dvAreaChart_web

Area Chart

dvBarChart_web

Bar Chart

dvBulletGraphGauge

Bullet Graph

dvCircularChart

Circular/Radial Chart

dvCircularGauge_web

Circular Gauge

dvColumnChart_web

Column Chart

dvDoughnutChart_web

Doughnut Chart

dvFunnelChart_web

Funnel Chart

dvLineChart_web

Line Chart

dvLinearGauge_web

Linear Gauge

dvPieChart_web

Pie Chart

dvSplineChart_web

Spline Chart

dvSplineArea_web

Spline with Area Chart

dvStackedAreaChart_web

Stacked Area Chart

dvStackedBarChart_web

Stacked Bar Chart

dvStackedColumn_web

Stacked Column Chart

dvStepAreaChart_web

Step Area Chart

dvStepLineChart_web

Step Line Chart

dvTextGauge_web

Text Gauge

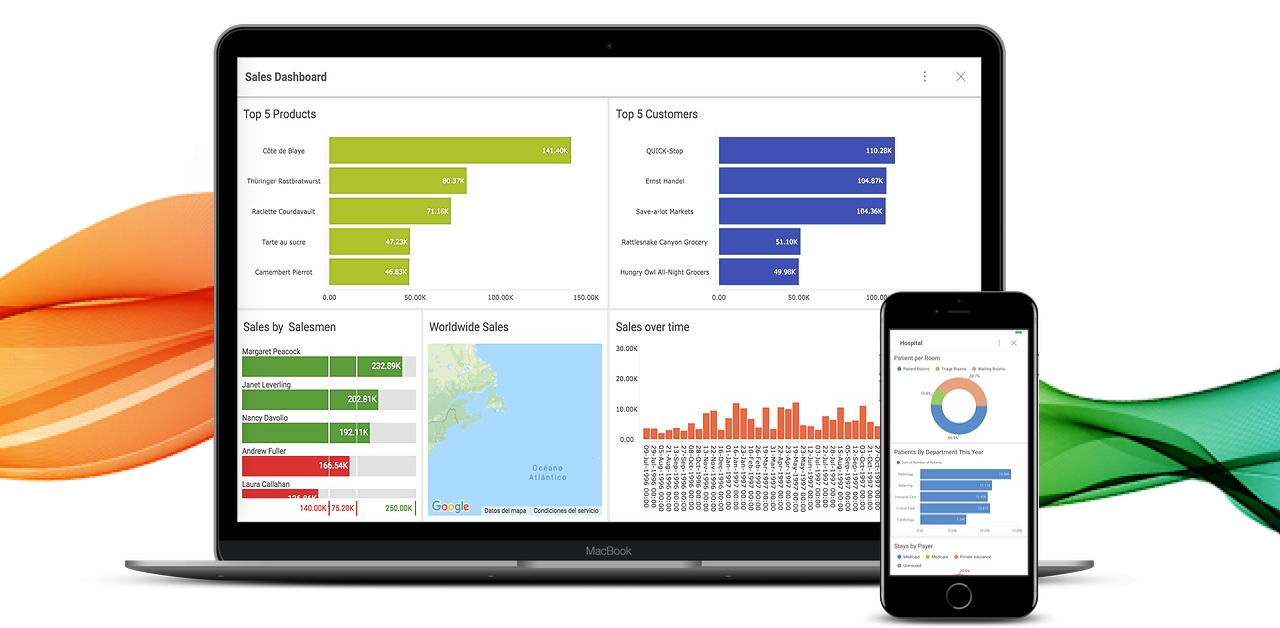
Dashboard samples, composed by several visualizations:

dataVisualizationsDashboardComposition_web

For further information, refer to Reveal’s user guide here