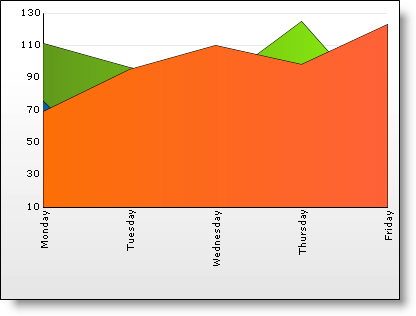

A 2D area chart emphasizes the amount of change over a period of time or compares multiple items. An area chart also shows the relationship of parts to a whole by displaying the total of the plotted values.
An area chart is a form of line chart, but the area between the x-axis (horizontal axis) and the line connecting the data markers is filled with color. This makes it easy to see where the points encompassed by the different data series overlap.
If you want your chart to display data in chronological order, and plot points across the x-axis according to elapsed time, see Display Data on a Time-Scale Axis.
