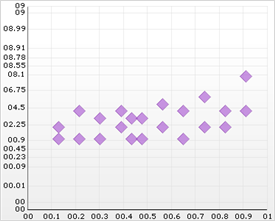

A probability chart is a modified scatter chart which is typically used to plot a level of probability (Y) against a variable (X). The major difference between a probability chart and scatter chart is that in a probability chart, the y-axis scale uses a Gaussian distribution (also known as Normal distribution) algorithm.
