This topic provides sample code that demonstrates how to take three-dimensional data or data from multiple tables and place the data into one virtual table so that the Chart control can display it.
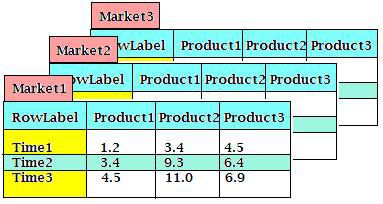
For example, the image below illustrates three distinct tables on which a chart is based.

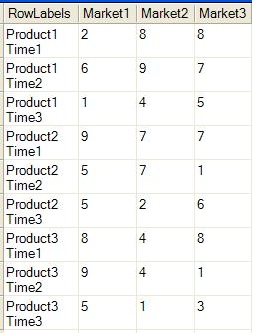
The Chart control requires a flat data set in order to graph data, therefore, you must transform the data into a flat recordset as shown in the example table below.

All tables must have the same number of columns and rows; otherwise, you must modify the code to create data tables to work with your own situation. The sample code below uses tables with three columns and three rows. If you are working with predefined tables, make sure they meet these criteria.
In Visual Basic:
' Create and add each table to the dataSet
Dim dataSet1  As New DataSet("MarketDataSet")
Dim Market1 As DataTable = dataSet1.Tables.Add("Market1")
Dim Market2 As DataTable = dataSet1.Tables.Add("Market2")
Dim Market3 As DataTable = dataSet1.Tables.Add("Market3")
' Add columns to all tables, Add rows to tables
Dim rnd As Random = New Random(0)
Dim x As Integer
For x = 0 To dataSet1.Tables.Count - 1
	' Add labels column
	dataSet1.Tables(x).Columns.Add("Time", GetType(String))
	' Add 3 Data Columns
	Dim z As Integer
	For z = 0 To 2
		dataSet1.Tables(x).Columns.Add("Product " & (z + 1), _
		  GetType(Double))
	Next z
	' Add rows to the table
	Dim y As Integer
	For y = 0 To 2
			dataSet1.Tables(x).Rows.Add(New Object() _
			  {"time " & (y + 1), _
			rnd.Next(1, 10), rnd.Next(1, 10), rnd.Next(1, 10)})
	Next y
Next x
In C#:
// Create and add each table to the dataSet
DataSet dataSet= new DataSet("MarketDataSet");
DataTable Market1=dataSet.Tables.Add("Market1");
DataTable Market2=dataSet.Tables.Add("Market2");
DataTable Market3=dataSet.Tables.Add("Market3");
// Add columns to all tables, Add rows to tables
Random rnd = new Random(0);
for(short x=0; x<dataSet.Tables.Count; x++)
{
	// Add labels column
	dataSet.Tables[x].Columns.Add("Time",typeof(string));
	// Add 3 Data Columns
	for(short i=0; i<3; i++)
	{
		dataSet.Tables[x].Columns.Add("Product " + (i+1),typeof(double));
	}
	// Add rows to the table
	for(short y=0; y<3; y++)
	{
		dataSet.Tables[x].Rows.Add(new Object[]{"time " + (y+1),
		rnd.Next(1,10),rnd.Next(1,10),rnd.Next(1,10) });
	}
}
Take the data from the two data sets and place it into a single table that can be used by the chart element.
In Visual Basic:
' Tranform these tables into one
Dim AllMarkets As DataTable = dataSet1.Tables.Add("AllMarkets")
AllMarkets.Columns.Add("LabelsColumns")
Dim i As Integer
For i = 0 To (dataSet1.Tables.Count - 2)
	AllMarkets.Columns.Add(dataSet1.Tables(i).TableName, GetType(Double))
Next i
Dim table1 As DataTable = dataSet1.Tables(0)
Dim table2 As DataTable = dataSet1.Tables(1)
Dim table3 As DataTable = dataSet1.Tables(2)
Dim Pcnt As Integer = 1
' This keeps track of the product number
Dim Tcnt As Integer = 1
' This keeps track of the time number
For i = 0 To (((table1.Rows.Count) $$*$$ (table1.Columns.Count - 1)) - 1)
	' If the time count is 4, reset the time count back to 1
	' and increase the product count by 1
	' These counters keep track of which product on which time
	' we are inserting into the new table
	If Tcnt = 4 Then
		Pcnt += 1
		Tcnt = 1
	End If
	' Add new rows to the table
	' Cell one is a combination of the column name and row label
	' Subsequent cells are get the value from original table using the method
	' table1.Rows(Tcnt-1)(Pcnt) where the first parameter is the row number
	' and the second is the column number based on our counts
	AllMarkets.Rows.Add(New Object() {table1.Columns(Pcnt).ColumnName _
	+ " " + table1.Rows(Tcnt - 1)(0), table1.Rows(Tcnt - 1)(Pcnt), _
	table2.Rows(Tcnt - 1)(Pcnt), table3.Rows(Tcnt - 1)(Pcnt)})
	Tcnt += 1
Next i
Me.UltraChart1.Data.DataSource = dataSet1.Tables("AllMarkets")
In C#:
// Transform these tables into one
DataTable AllMarkets=dataSet.Tables.Add("AllMarkets");
AllMarkets.Columns.Add("LabelsColumns");
for(short i=0;i<dataSet.Tables.Count-1; i++)
{
	AllMarkets.Columns.Add(dataSet.Tables[i].TableName, typeof(double));
}
DataTable table1=dataSet.Tables[0];
DataTable table2=dataSet.Tables[1];
DataTable table3=dataSet.Tables[2];
int Pcnt=1;
// This keeps track of the product number
int Tcnt=1;
// This keeps track of the time number
for (short i=0; i<table1.Rows.Count$$*$$(table1.Columns.Count-1); i++)
{
	// If the time count is 4, reset the time count back to 1
	// and increase the product count by 1
	// These counters keep track of which product on which time
	// we are inserting into the new table
	if(Tcnt==4)
	{
		Pcnt+=1;
		Tcnt=1;
	}
	// Add new rows to the table
	// Cell one is a combination of the column name and row label
	// Subsequent cells are get the value from original table
	// using the method
	// table1.Rows[Tcnt-1][Pcnt] where the first parameter is the
	// row number and the second is the column number based on our counts
	AllMarkets.Rows.Add(new Object[]{table1.Columns[Pcnt].ColumnName+ " " +
	  table1.Rows[Tcnt-1][0],table1.Rows[Tcnt-1][Pcnt],
	  table2.Rows[Tcnt-1][Pcnt], table3.Rows[Tcnt-1][Pcnt]});
	Tcnt+=1;
}
this.ultraChart1.Data.DataSource=dataSet.Tables["AllMarkets"];
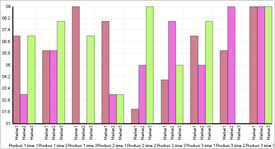
The final chart should look similar to the chart image below.
