UltraDataPieChart dataPieChart = new UltraDataPieChart()
{
    Dock = DockStyle.Fill,
    DataSource = data,
    HighlightingMode = SeriesHighlightingMode.BrightenSpecific,
    HighlightingBehavior = SeriesHighlightingBehavior.NearestItems
};
This topic provides information for enabling and using the different highlighting features in the UltraDataPieChart control.
The topic contains the following sections:
This article assumes you have already read the Data Binding topic, and uses the code within it as a starting point.
The UltraDataPieChart supports mouse over highlighting, as well as a highlighting overlay that can be configured by providing a separate data source. The following sections describe these features in more detail:
The HighlightingBehavior property determines how a slice will be highlighted. This is represented by a SeriesHighlightingBehavior enumeration. The following are the options of that enumeration and what they do:
DirectlyOver: The slices are only highlighted when the mouse is directly over them.
NearestItems: The nearest slice to the mouse position will be highlighted.
NearestItemsAndSeries: The nearest slice and series to the mouse position will be highlighted.
NearestItemsRetainMainShapes: The nearest items to the mouse position will be highlighted and the main shapes of the series will not be de-emphasized.
The HighlightingMode property determines how the data pie chart slices respond to being highlighted. This property is defined by the SeriesHighlightingMode enumeration. The following are the options of that enumeration and what they do:
Brighten: The series will have its color brightened when the mouse position is over or near it.
BrightenSpecific: The specific slice will have its color brightened when the mouse position is over or near it.
FadeOthers: The series will retain its color when the mouse position is over or near it, while the others will appear faded.
FadeOthersSpecific: The specific slice will retain its color when the mouse position is over or near it, while the others will appear faded.
None: The series and slices will not be highlighted.
In C#:
UltraDataPieChart dataPieChart = new UltraDataPieChart()
{
Dock = DockStyle.Fill,
DataSource = data,
HighlightingMode = SeriesHighlightingMode.BrightenSpecific,
HighlightingBehavior = SeriesHighlightingBehavior.NearestItems
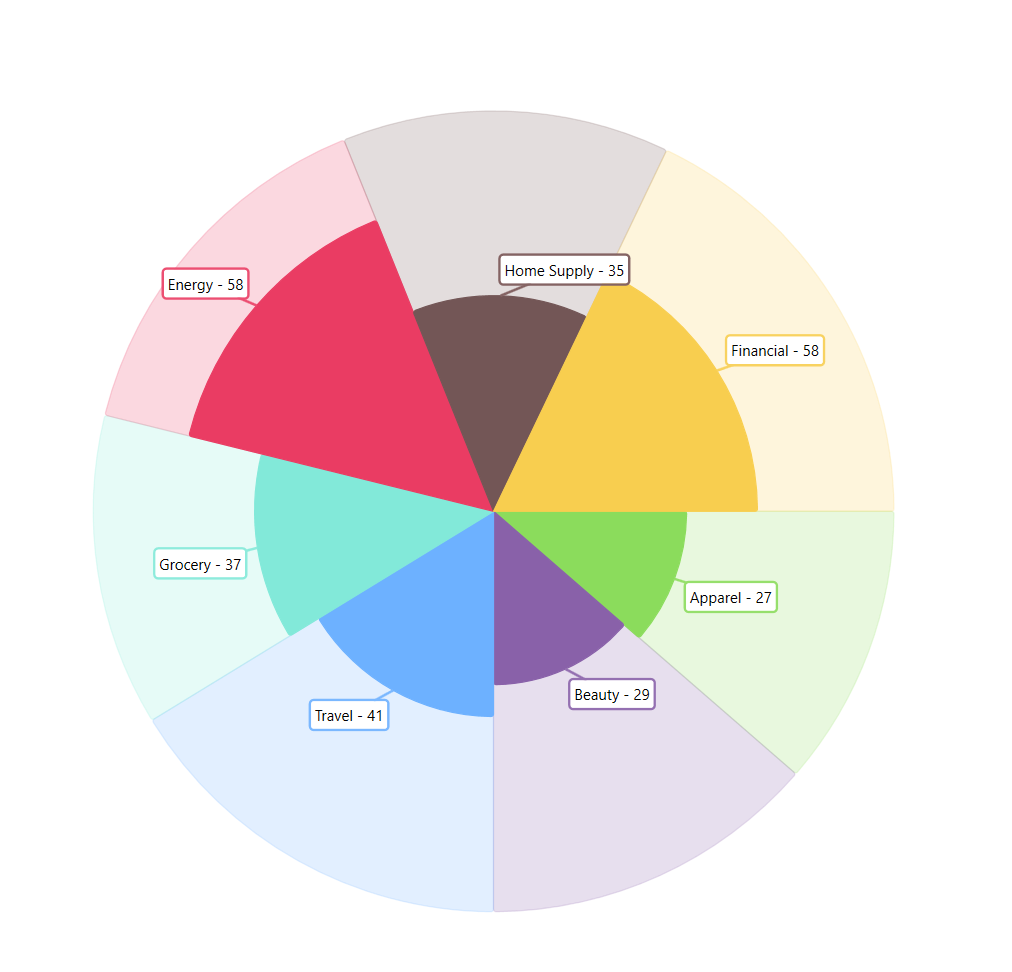
};The highlight filter of the UltraDataPieChart is applied by specifying a HighlightedDataSource for the control and by setting the HighlightedValuesDisplayMode property to Overlay. The HighlightedDataSource expects a subset of the data assigned to the DataSource property of the UltraDataPieChart.
When these conditions are met, the values of the subset will be highlighted, while the remainder of the full set of data will be faded - effectively creating a highlight for the subset and allowing easier visualization of a subset of your data within the same control.
In C#:
UltraDataPieChart dataPieChart = new UltraDataPieChart()
{
    Dock = DockStyle.Fill,
    DataSource = new OnlineTrafficHighlightTotals(),
    HighlightedItemsSource = new OnlineTrafficHighlightDesktopOnly(),
    HighlightedValuesDisplayMode="Overlay"
};In C#:
public class OnlineTrafficHighlightTotalsItem
{
    public string Category { get; set; }
    public double Value { get; set; }
}

public class OnlineTrafficHighlightTotals
    : List<OnlineTrafficHighlightTotalsItem>
{
    public OnlineTrafficHighlightTotals()
    {
        this.Add(new OnlineTrafficHighlightTotalsItem()
        {
            Category = @"Apparel",
            Value = 56
        });
        this.Add(new OnlineTrafficHighlightTotalsItem()
        {
            Category = @"Beauty",
            Value = 67
        });
        this.Add(new OnlineTrafficHighlightTotalsItem()
        {
            Category = @"Travel",
            Value = 80
        });
        this.Add(new OnlineTrafficHighlightTotalsItem()
        {
            Category = @"Grocery",
            Value = 62
        });
        this.Add(new OnlineTrafficHighlightTotalsItem()
        {
            Category = @"Energy",
            Value = 74
        });
        this.Add(new OnlineTrafficHighlightTotalsItem()
        {
            Category = @"Home Supply",
            Value = 65
        });
        this.Add(new OnlineTrafficHighlightTotalsItem()
        {
            Category = @"Financial",
            Value = 88
        });
    }
}

public class OnlineTrafficHighlightDesktopOnlyItem
{
    public string Category { get; set; }
    public double Value { get; set; }
}

public class OnlineTrafficHighlightDesktopOnly
    : List<OnlineTrafficHighlightDesktopOnlyItem>
{
    public OnlineTrafficHighlightDesktopOnly()
    {
        this.Add(new OnlineTrafficHighlightDesktopOnlyItem()
        {
            Category = @"Apparel",
            Value = 27
        });
        this.Add(new OnlineTrafficHighlightDesktopOnlyItem()
        {
            Category = @"Beauty",
            Value = 29
        });
        this.Add(new OnlineTrafficHighlightDesktopOnlyItem()
        {
            Category = @"Travel",
            Value = 41
        });
        this.Add(new OnlineTrafficHighlightDesktopOnlyItem()
        {
            Category = @"Grocery",
            Value = 37
        });
        this.Add(new OnlineTrafficHighlightDesktopOnlyItem()
        {
            Category = @"Energy",
            Value = 58
        });
        this.Add(new OnlineTrafficHighlightDesktopOnlyItem()
        {
            Category = @"Home Supply",
            Value = 35
        });
        this.Add(new OnlineTrafficHighlightDesktopOnlyItem()
        {
            Category = @"Financial",
            Value = 58
        });
    }
}