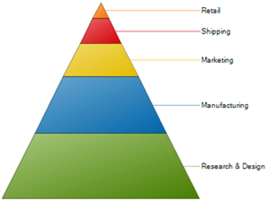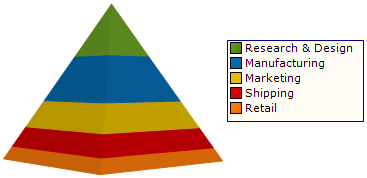
Among the new charts being added in the 2006 Volume 2 release are the 2D and 3D Pyramid charts. The Pyramid chart provides you with a dramatic way to display segments as quantities of a whole. By using the Pyramid chart in your application, your end users can quickly determine the significance of each segment by comparing the height of the segment against that of the entire pyramid.

