
A number of 3D charts have been added to our suite of charts in the 2006 volume 1 release to provide you with even more ways to provide 3D orientation to your graphs. Click each link below to view an example image of each chart so you have a visual idea of how captivating the new 3D chart is:
Along with offering new 3D charts, we’ve redesigned the following existing 3D charts to allow them to take advantage of the new 3D charting engine. Click each link below to view an example image of the much-improved 3D charts:
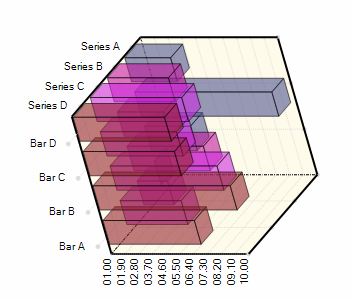
An example screenshot of a 3D Bar Chart rendered with our old 3D chart-rendering engine is shown below (left). In the example screenshot below (right), take a look at the substantial improvement in image quality and appearance of the 3D Bar Chart now that it has been rendered with our new 3D chart-rendering engine!
