<ig:XamCategoryChart ItemsSource="{Binding EnergySampleData}"
                     ChartType="Column"
                     XAxisTickLength = "7"
                     XAxisTickStrokeThickness = "2"
                     XAxisTickStroke = "Red"
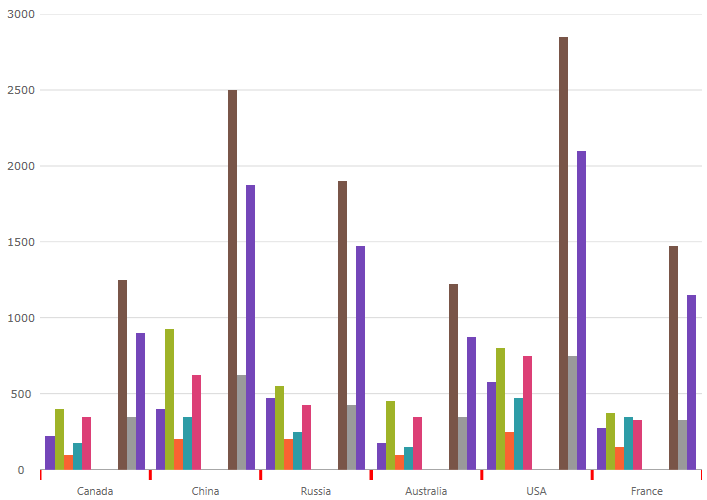
/>Tick marks display points on the axes. They represent a certain numeric point on a scale or the value of the underlying data item in a category axis.
This topic contains the following sections:
In the XamCategoryChart control, you can change the length, thickness, and color of the x-axis and y-axis tickmarks using the following properties:
The following code snippet demonstrates how to set the color, length and thickness of the tickmark on the x-axis.
In XAML:
<ig:XamCategoryChart ItemsSource="{Binding EnergySampleData}"
ChartType="Column"
XAxisTickLength = "7"
XAxisTickStrokeThickness = "2"
XAxisTickStroke = "Red"
/>