In the XamDataChart™ control, axis labels always display simple text without any formatting applied to them. However, you can change the format of axis labels by setting a formatting string on the
Label property of any type of Axis.
For example, if you are plotting monetary data along y-axis, the default labels will simply display a decimal representation of your monetary values. If you want to display these values with currency symbols, you need to use C format specifier, followed by a number, specifying decimal precision. For detailed information on .NET Framework composite format strings please refer to the following online resources:
The following code example shows how to format labels on CategoryXAxis and NumericYAxis using date formatting and currency formatting:
|
Note
|
Note:
Curly braces ('{' and '}') in XAML are special characters for markup extensions. If the first value of a string needs to be a curly brace, an empty set of curly braces must be used as an escape sequence. This allows the text following the empty set of curly braces to be taken as a literal value.
|
<ig:XamDataChart x:Name="DataChart"   >
    <ig:XamDataChart.Axes>
        <ig:CategoryXAxis x:Name="commonXAxis" Label="{}{Date:MM/dd}"
                         ItemsSource="{Binding}" >
            <ig:CategoryXAxis.LabelSettings>
                <ig:AxisLabelSettings Location="OutsideBottom"/>
            </ig:CategoryXAxis.LabelSettings>
        </ig:CategoryXAxis>
        <ig:NumericYAxis x:Name="priceYAxis" Label="{}{0:C1}">
            <ig:NumericYAxis.LabelSettings>
                <ig:AxisLabelSettings Location="OutsideLeft"/>
            </ig:NumericYAxis.LabelSettings>
        </ig:NumericYAxis>
        <ig:NumericYAxis x:Name="volumeYAxis" Label="{}{0:#,0} K" >
            <ig:NumericYAxis.LabelSettings>
                <ig:AxisLabelSettings Location="OutsideRight"/>
            </ig:NumericYAxis.LabelSettings>
        </ig:NumericYAxis>
    </ig:XamDataChart.Axes>
</ig:XamDataChart>
var commonAxis = new CategoryXAxis();
var pricesAxis = new NumericYAxis();
var volumeAxis = new NumericYAxis();
commonAxis.Label = "{Date:MM/dd}";
pricesAxis.Label = "{0:C1}";
volumeAxis.Label = "{0:#,0} K";
Dim commonAxis As New CategoryXAxis()
Dim pricesAxis As New NumericYAxis()
Dim volumeAxis As New NumericYAxis()
commonAxis.Label = "{Date:MM/dd}"
pricesAxis.Label = "{0:C1}"
volumeAxis.Label = "{0:#,0} K"
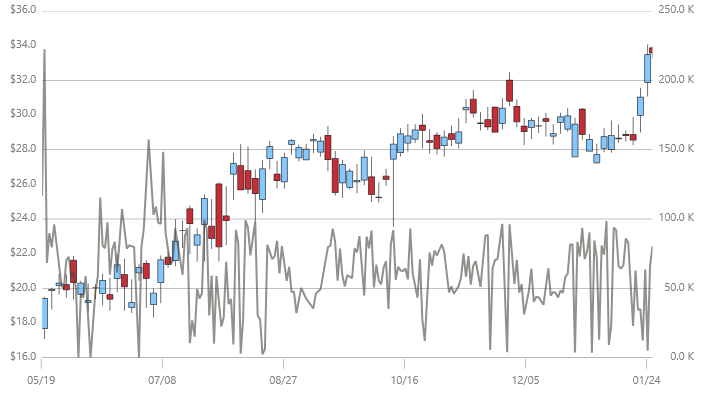
The following image shows how the XamDataChart control might look with formatted date on CategoryXAxis and formatted currency on NumericYAxis.